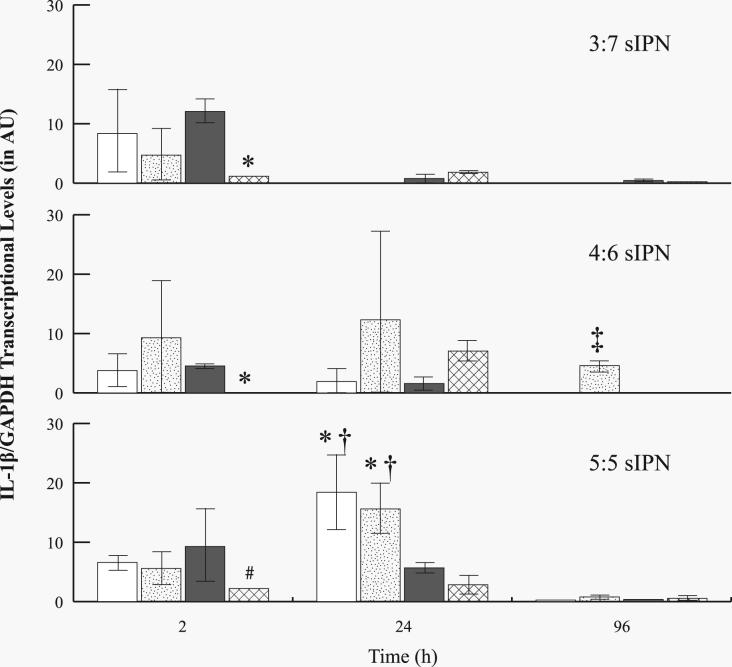
Figure 9.
RT-PCR analysis for IL-1β/GAPDH mRNA levels from adherent monocytes in the presence of 3:7, 4:6 and 5:5 wt% ratios of ligand-PEG grafted gelatin:PEGdA sIPNs: methoxy-( ), GGG-(
 ), RGD-(
 ), and PHSRN-PEG grafted sIPN (
 ). Data are expressed as mean ± s.d. #Significantly different (p<0.05) from methoxy-PEG grafted sIPN (within sIPN group and time point). *Significantly different (p<0.05) from RGD-PEG grafted sIPN (within sIPN group and time point). †Significantly different (p<0.05) from PHSRN-PEG grafted sIPN (within sIPN group and time point). †Significantly different (p<0.05) from all other ligand-PEG grafted sIPN (within sIPN group and time point).

