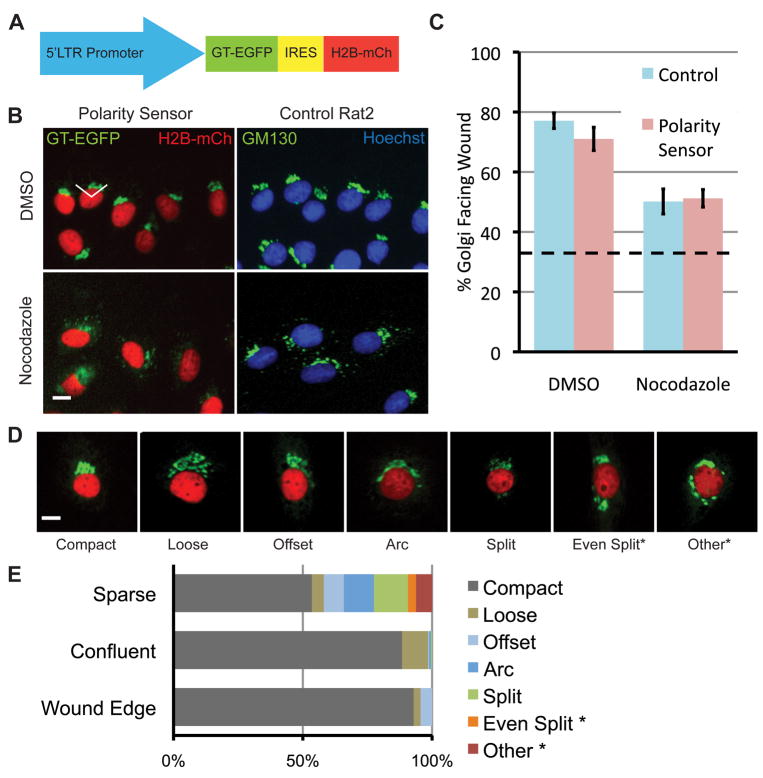
Fig. 1.
Characterization of the polarity sensor. (A) Polarity sensor design. The Golgi is marked with the first 81 amino acids of GT fused to EGFP. The nucleus is marked with H2B fused to mCherry. These sequences flank an internal ribosomal entry sequence (IRES) to allow simultaneous expression from a single promoter. (B) Representative images of cells in the scratch-wound assay treated with either DMSO (control) or nocodazole (0.1 μg/ml). Uninfected Rat2 cells are labeled with anti-GM130 (green) and Hoechst (blue) to mark the Golgi and nucleus, respectively. The wound edge is up, the white lines indicate ±60° facing the wound edge, considered polarized. Scale bar = 10 μm. (C) Quantification of results in (B). Results are from at least 100 cells per treatment from each of 3 independent experiments. Data were analyzed using one-way ANOVA and Tukey’s post-hoc test. Error bars = S.E.M.; dashed line indicates random Golgi positioning. (D) Golgi morphology is heterogeneous. Representative images of different Golgi morphologies observed in sparsely plated cells. Scale bar = 10 μm. (E) Quantification of results in (D). Two categories of Golgi morphology, indicated by asterisks, were excluded from subsequent analyses because the Golgi position could not be determined.

