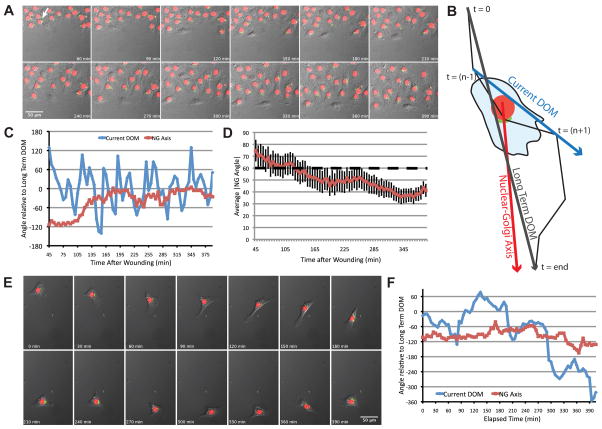
Fig. 2.
The NGA aligns with the direction of migration into the wound but does not align with the direction of migration in freely migrating cells. (A) Representative time-lapse images of Rat2 cells expressing the polarity sensor in the scratch-wound assay. The arrow indicates the cell analyzed in (C). (B) Schematic diagram of axes used for analysis. The cell track is represented by the black line, from t=0 to t=end. These two points define the long-term DOM (turquoise arrow). The current DOM at t=n is defined by the position of the cell centroid at t=(n−1) and t=(n+1) (blue arrow). The NGA is the vector defined by the current nuclear and Golgi positions (red arrow). (C) Current DOM and NGA relative to the long-term DOM over time for the representative cell indicated in (A). (D) The average absolute value of NGA relative to the long-term DOM for multiple cells (n~60) in the wound healing assay over time. Error bars = S.e.M. (E) Time-lapse images of a freely migrating cell expressing the polarity sensor. (F) Current DOM and NGA of the cell in (E) relative to the long-term DOM over time. In this case, DOM was calculated from the hand-outlined track.

