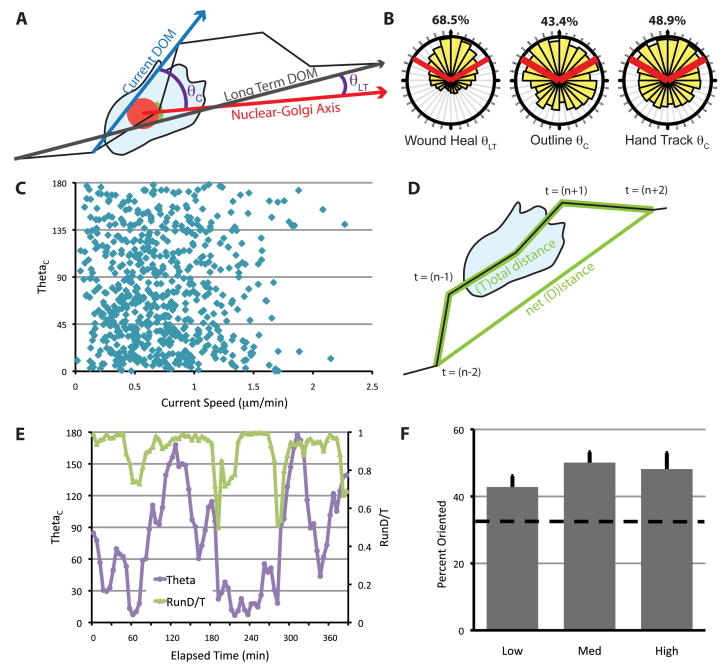
Fig. 3.
Nucleus-Golgi polarity is not correlated with the direction of migration in freely migrating cells. (A) Schematic for calculating θ. θLT is used for cells in the scratch wound assay and θC is used for freely migrating cells. The current DOM (and θC) was calculated from cell centroids determined in two ways, as described in the text and Fig. S1. (B) The distribution of θ for cells at the wound edge or in freely migrating cells. Red lines indicate ±60° facing the DOM, and the percentage of data that fall within these boundaries are indicated above. Data were generated from at least three independent experiments with at least 100 cells total for each condition, tracked over at least 5 h. (C) θ as a function of current cell speed. Current cell speed was calculated using tracks from outlined cells over 10 min from (t−1) to (t+1). (D) RunD/T was calculated as a sliding window using cell centroids from time (t−2), (t−1), (t), (t+1) and (t+2). D/T is defined as the net path length (D) divided by the total path length (T). (E) θ and RunD/T for the cell shown in Fig. 2E over time. RunD/T was calculated from the hand-outlined track of this cell. (F) Percentage of times when the Golgi is oriented (θ < 60°), during times when RunD/T is high (≥ 0.9), medium (0.9 > RunD/T > 0.7) or low (< 0.7) in freely migrating cells. RunD/T was calculated from the hand-tracked positions, and instances when cells were deemed too slow for accurate tracking were eliminated (see Fig. S1). The dashed line indicates random Golgi positioning. Error bars = S.E.M. Data were generated from four independent experiments with at least 100 cells total.

