
Figure 10.
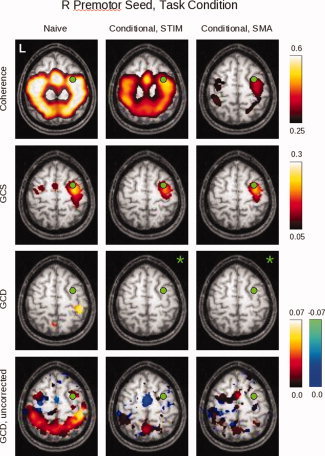
Here can be seen the results of the conditional analyses for group data obtained for the right premotor (PMC) ROI during task performance. The non‐conditional (“naive”) analysis is shown in the left column; the analysis conditioned on the stimulus is shown in the middle column; and the analysis conditioned on the SMA activity is shown in the right column (for slice Z = 58). Images in which no voxel reached a significance of P < 0.05, corrected, are denoted by green asterisks. Because such images only occur in the GCD analysis, the bottom row shows the same GCD maps for an uncorrected SnPM99 “pseudo‐P” value of 0.05 to reveal the underlying map structure. [Color figure can be viewed in the online issue, which is available at www.interscience.wiley.com.]