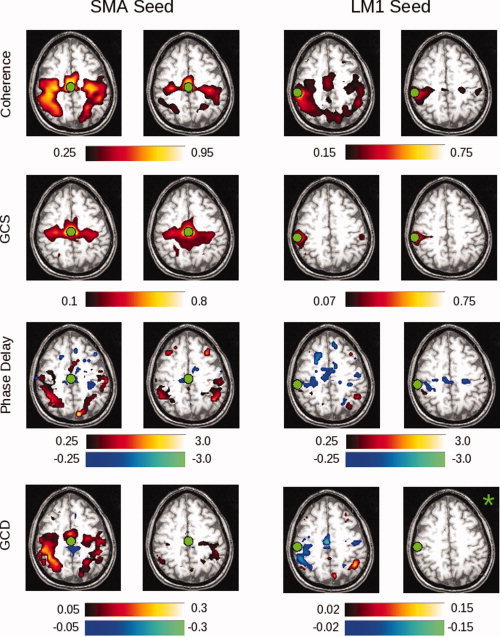
Figure 6.

Shown in the two left columns are the results of native‐space exploratory analyses, using a seed in the SMA, for subject 212. The two right columns demonstrate results for a left M1 (LM1) seed. Areas shaded in “hot” (red–yellow) hues represent positive values; areas shaded in “cool” (blue–green) hues represent negative values. Thus, activity in a red voxel in the GCD or phase delay maps occurs after (i.e., lags) activity in the seed region. Green circles indicate the location of the SMA or LM1 ROI. Each “task” and “rest” map is created by computing the false discovery rate for a P‐value of 0.05, as determined by comparing with the null distribution (described in Methods). Those images marked by a green asterisk (*) contained no voxels significant at P < 0.05, corrected. Among other findings, the maps demonstrate that activity in the SMA leads, rather than lags, activity in the left M1 seed region. [Color figure can be viewed in the online issue, which is available at www.interscience.wiley.com.]
