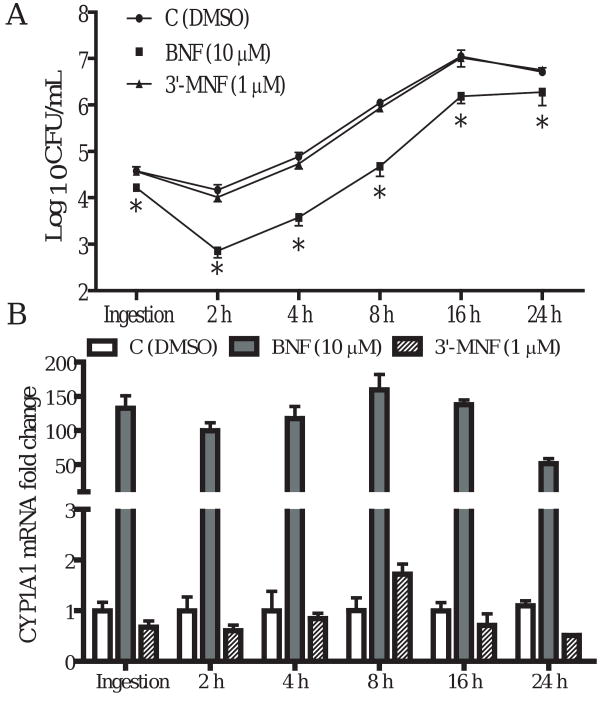
Figure 1.
Time-course studies of the invasion and intracellular multiplication of L. monocytogenes in TIB73 cells after BNF treatment. TIB73 cells were pretreated with BNF (10 μM), 3′-MNF (1 μM), or DMSO for 5 h before being infected with 105 log-phase L. monocytogenes for 2 h (Ingestion). Cells were then washed extensively to remove extracellular Listeriae and incubated in media with 5 μg/mL gentamycin for 2 to 24 h. A. CFU of L. monocytogenes recovered from infected TIB73 cells: Infected cells were lysed in sterile H2O to determine the CFU. Symbols indicate: BNF (10 μM) ( ), 3′-MNF (1 μM) (
 ), or DMSO (
 ). Data represent the mean±SEM Log10CFU/mL of six independent experiments. *: p<0.05, as compared to the control group. B. Fold change in CYP1A1 mRNA after being normalized to the control (GAPDH). Identically-treated TIB73 cells were used to isolate RNA for real-time RT-PCR analyses of CYP1A1. Data represent mean±SEM fold change of six independent experiments that were performed. Symbols indicate BNF (10 μM) (
 ), 3′-MNF (1 μM) (
 ), or DMSO (
 ).
).

