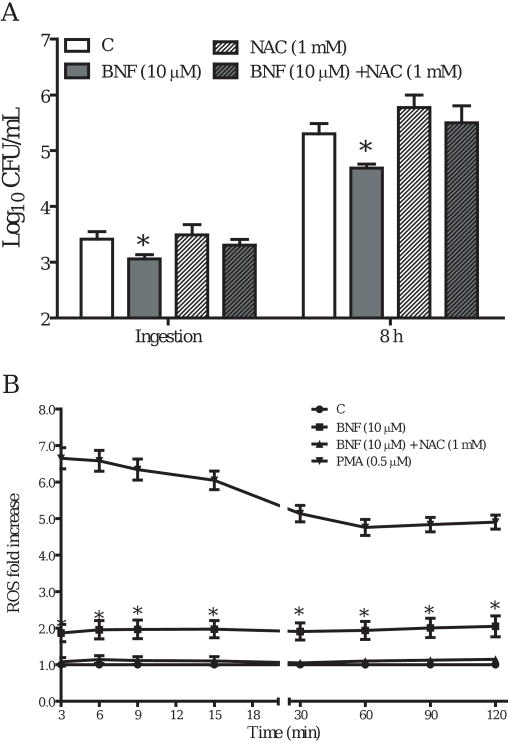
Figure 8.
NAC treatment blocks the inhibition of L. monocytogenes induced by BNF. TIB73 cells were pretreated with DMSO, BNF alone (10 μM), NAC alone (1 mM), or BNF (10 μM) and NAC (1 mM) in combination for 5 h. A. Pretreated cells were infected with 105 log-phase L. monocytogenes for 2 h (Ingestion). Cells were washed extensively to remove extracellular L. monocytogenes. Infected cells were lysed in sterile H2O to estimate the ingested L. monocytogenes or incubated in media with 5 μg/mL gentamycin for 8 h to determine the intracellular multiplication of L. monocytogenes (8 h). Used symbols indicate: DMSO ( ), BNF alone (10 μM) (
 ), NAC alone (1 mM) (
 ), or BNF (10 μM) and NAC (1 mM) in combination (
 ). Data represent the mean±SEM Log10CFU/mL of three representative experiments. *: p<0.05 as compared to the control group. B. Pretreated cells were loaded with 200 μM of DFF in growth medium for 1 h. The DFF loading medium was replaced with pre-warmed growth medium supplemented with BNF (10 μM) (
 ), 3′-MNF (1 μM) (
 ), or DMSO (
 ) after 1× wash with pre-warmed HBSS. Cells treated with PMA (0.5 μM) served as a positive control (
 ). The production of ROS was monitored using a fluorescent microplate reader after addition of 105 log-phase L. monocytogenes. Data represent the mean±SEM fold change of 3 representative experiments, relative to the control by arbitrarily setting the control level at 1. *: p<0.05, as compared to the control.

