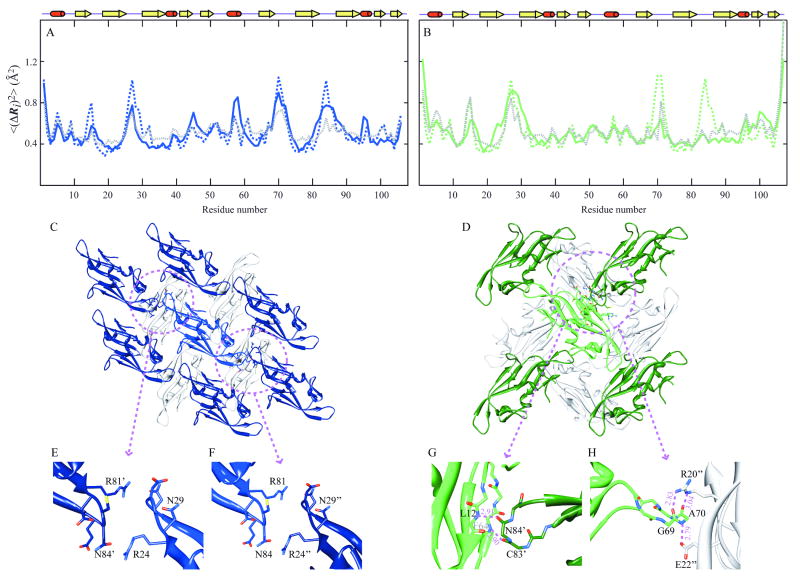
Figure 5. Comparison of theoretical and experimental residue fluctuations based on crystal packing of LKAMG in two different lattices.
Panels A and B refer to the crystal structures X1 and X2, respectively. Mean-square fluctuations of residues predicted by the GNM for the isolated protein (dashed blue in panel A, dashed green in panel B) and those in the crystal lattice (dashed gray in both panels) are compared with those inferred from X-ray crystallographic B-factors (solid blue and green in the respective panels). (C) and (D) ribbon diagram of LKAMG surrounded by its first neighbors in the respective p21 (X1) and p212121 (X2) crystal forms. The total number of surrounding molecules is 14 and 12 in the respective crystals. Four symmetrically related molecules on the upper plane are not displayed in each diagram for clarity. Encircled regions are enlarged in panels E, F, G, and H. Panels (E) and (F) highlights the inter-molecular contacts in X1, (G) and (F) those in X2.

