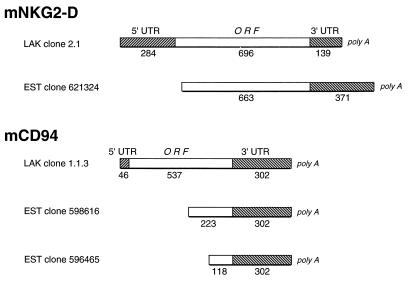
Figure 1.
Schematic diagram depicting the relationship between the murine LAK cDNA clones for mNKG2-D (Upper) and mCD94 (Lower) and the corresponding EST clones. Hatched boxes, the 5′ and 3′ UTRs; open boxes, coding sequences of the ORFs. The numbers below each section indicate length in nucleotides.

