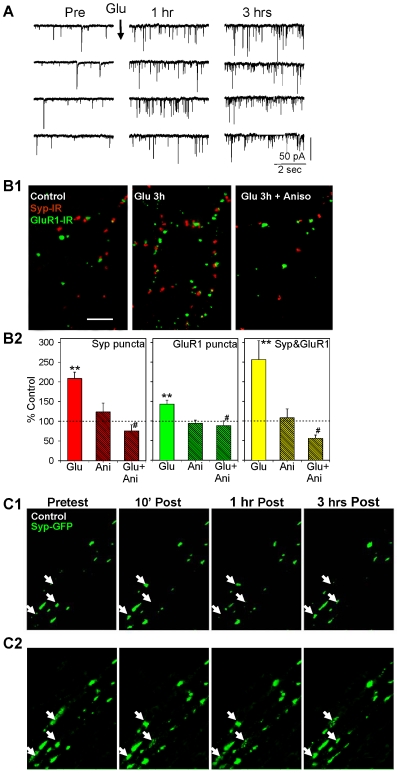
Figure 1. Glutamate-induced late-phase potentiation of the frequency of mEPSCs is accompanied by a protein synthesis-dependent increase in the number of clusters or puncta of synaptic proteins, which aggregate and disaggregate at fixed sites.
A. Examples of spontaneous mEPSCs before (Pre) and 1 hr and 3 hrs after brief application of glutamate. B1. Examples of synaptophysin-immunoreactive (IR) puncta (red), GluR1-IR puncta (green), and colocalization (either yellow or adjacent red and green) in dishes fixed 3 hrs after brief application of saline (control), glutamate, or glutamate following pretreatment with anisomycin. Scale bar, 10 µM. B2. Average results from experiments like the ones shown in B1 (n = 9 dishes in each group). In this and subsequent figures the graphs show the means and SEMs, ** = p<0.01, * = p<0.05, + = p<0.05 one-tail compared to control, # = p<0.05, + = p<0.05 one-tail compared to no inhibitor. The average number of puncta in ten fields (94 µm×142 µm) per dish has been normalized to the number in comparable fields in control dishes from the same culture batch. The average control values per field were 35 (synaptophysin), 68 (GluR1), and 12 (colocalized). C1. Examples of synaptophysin-GFP fluorescent puncta before (Pretest) and 10 min, 1 hr, and 3 hrs after (Post) brief application of saline (control). C2. The same images as C1 (which were generated with an intensity threshold to facilitate recognition and counting of the puncta) without the threshold, showing that the puncta undergo continual aggregation, disaggregation, and reaggregation at fixed sites (the arrows indicate three examples).

