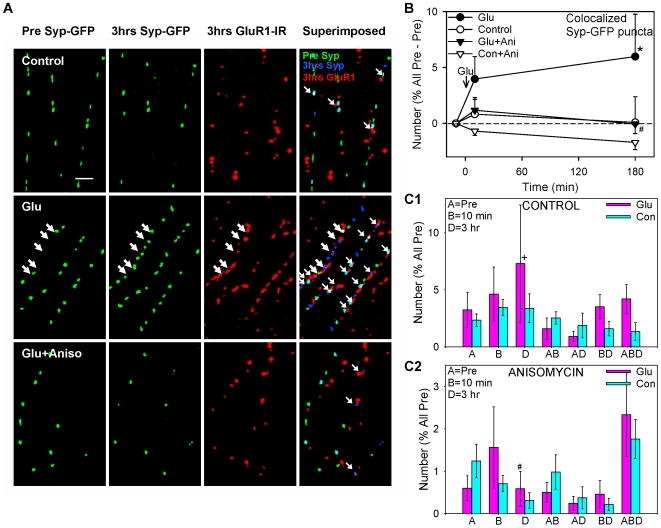
Figure 3. Some of the synaptophysin-GFP puncta colocalize with GluR1-IR puncta at 3 hrs, and those puncta behave similarly to all Syp-GFP puncta.
A. Examples from the same experiments as Fig. 2A showing synaptophysin-GFP fluorescent puncta (green) before and 3 hrs after, and GluR1-IR puncta (red) 3 hrs after brief application of saline (control), glutamate, or glutamate following pretreatment with anisomycin. In the last column the three images in each experiment have been superimposed and color coded to show colocalization of Syp-GFP puncta from the pretest (green) and 3 hrs (blue) with GluR1-IR puncta at 3 hrs (red). Thus Syp-GFP puncta from the pretest that colocalized with GluR1-IR puncta are either yellow or adjacent green and red, those from 3 hrs are either purple or adjacent blue and red, and those from both times are either white or adjacent light blue and red (small arrows). B. Average time course of changes in the number of Syp-GFP puncta at any time that colocalized with GluR1-IR puncta at 3 hrs (n = 8 control dishes, 10 glutamate, 10 anisomycin, 7 glutamate + anisomycin). Because there were sometimes no colocalized Syp-GFP puncta in the pretest, the number of colocalized Syp-GFP puncta has been normalized as the percentage of all Syp-GFP puncta in the pretest minus the colocalized pretest value in each experiment, so that zero represents no change. The average colocalized pretest value was 6.7, not significantly different between the groups by a 1-way ANOVA. C. Average number of colocalized Syp-GFP puncta that were present only in the pretest (A), 10 min (B), 3 hrs (D), and various combinations of times (AB, AD, etc.) after glutamate or saline control, from the same experiments as B.

