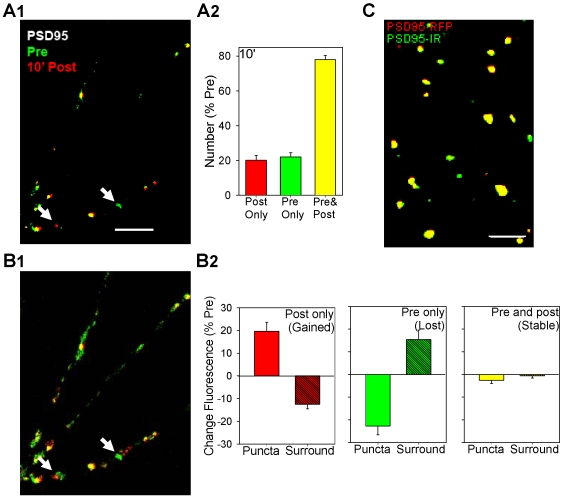
Figure 5. Puncta of PSD95-RFP aggregate and disaggregate like puncta of synaptophysin-GFP under control conditions.
A1. Example of PSD95-RFP puncta before (Pre, green) superimposed on those 10 min after (red) brief application of saline (control). Puncta that were present in the posttest only appear red, those that were present in the pretest only appear green, and those that were present at both times appear yellow. The arrows indicate two examples. Scale bar, 10 µm. A2. Average number of puncta that were present in the posttest only (red), the pretest only (green), or both times (yellow). The number of puncta in the field have been normalized to the number on the pretest in each experiment (average pretest value = 73, n = 21). B1. The same image as A1 without the threshold used to discriminate puncta from more diffuse background fluorescence. B2. Average changes in fluorescence of the puncta and the surrounding area within 5 µm for puncta that were present in the posttest only, the pretest only, or both times. The changes in fluorescence have been normalized to the total fluorescence of the puncta and surround on the pretest in each experiment. C. Example of puncta of PSD95-RFP (red), PSD95-IR (green), and colocalization (yellow). Scale bar, 10 µm. Most puncta colocalized but a few of each type did not, suggesting that the PSD95 monoclonal antibody did not simply recognize PSD95-RFP.

