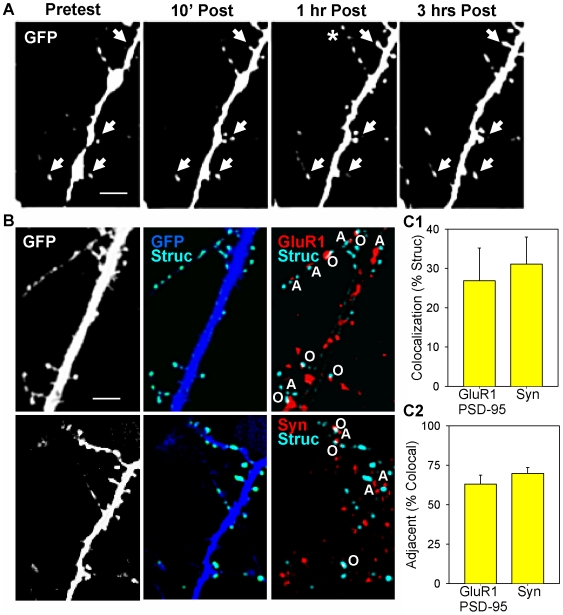
Figure 7. Examples of changes in small structures, automatic identification, and colocalization with puncta of synaptic proteins.
A. Neurons transfected with GFP, which labels the entire cell, before (Pretest) 10 min, 1 hr, and 3 hrs after brief application of saline (control). The arrows indicate examples of changes in small structures, and the asterisk indicates outgrowth of a filopodium. Scale bar, 10 µm. B. Automatic identification of small structures, and colocalization with synaptic proteins. Left. Original images of neurons transfected with GFP (white). Scale bar, 10 µm. Middle. Automatic identification of small structures (Struc, light blue) by subtracting a smoothed image from the original image (dark blue). Right. Some of the small structures colocalize with puncta that are immunoreactive (IR) for GluR1 (red, top) or synapsin (red, bottom). Colocalized structures are either overlapping (O) white or adjacent (A) light blue and red. C1. Average percentage of small structures that colocalized with puncta of the postsynaptic proteins GluR1 (n = 3 dishes) or PSD95 (n = 4), or the presynaptic protein synapsin (n = 6). Results for GluR1 and PSD95 were similar, and have been pooled. The number of colocalized structures in one field (94 µm×142 µm) per dish has been normalized to the total number of structures in that field (average value = 97). C2. Average percentage of colocalized small structures that were adjacent (within 1 µm) but did not overlap with puncta of GluR1, PSD95, or synapsin.

