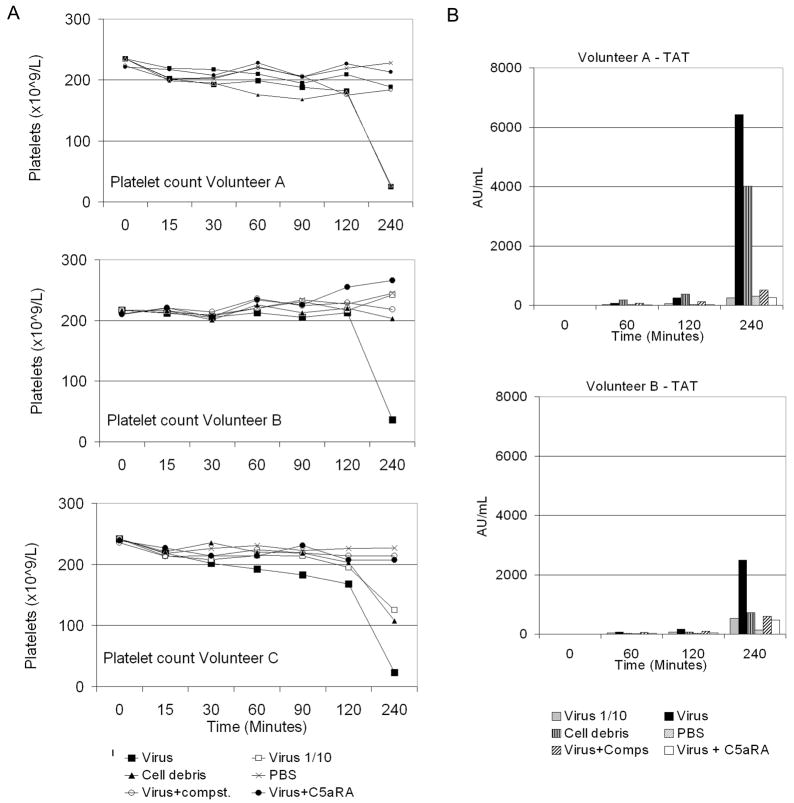
Figure 4.
Blood clotting was assessed over time. (A) Free platelets present in the blood were counted. Large squares = virus; small squares = 10-fold diluted virus; triangles = cell debris; crosses = PBS; open circles = virus plus Compstatin (Compst.) and filled circles = virus plus C5aRA. (B) Production of thrombin:antithrombin (TAT) complexes was measured using ELISA. Grey bars represent 10-fold diluted virus; black bars = undiluted virus; vertical striped bars = cell debris; spotted bars = PBS; diagonal striped bars = virus plus Compstatin (Comps) and white bars = virus plus C5aRA. The TAT assay failed for volunteer C.

