
Figure 2.
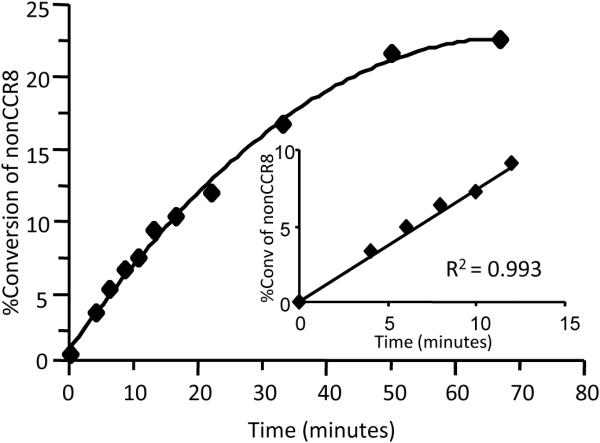
Progress curve for TPST-2 reaction time with insert showing the linear range. Optimal reaction time with linear response of substrate conversion to product can be reached when reaction time is ≤ minutes. TPST-2 concentration was set at 1.5 μM while PAPS at 1 mM and nonsulfated CCR8 at 20 μM.