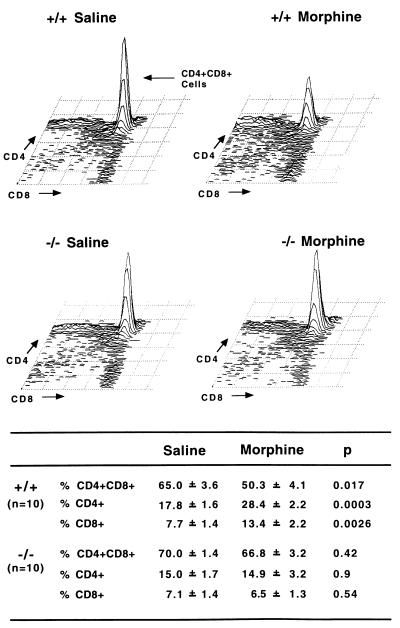
Figure 2.
Altered distribution of thymic cell populations in MOR +/+ but not in MOR −/− mutant mice after chronic morphine treatment. On top, a representative fluorescence-activated cell sorter analysis of thymocytes stained with fluorescent anti-CD4 and -CD8 antibodies highlights the decrease in CD4+CD8+ double positive cells and increase in single positive CD4+ and CD8+ cells after morphine in +/+ mice. The bottom table shows FACS analyses of thymocytes stained with fluorescent anti-CD4 and -CD8 antibodies for 10 individuals within each group. Results are expressed as mean ± SEM. The decrease in CD4+CD8+ double positive cells and increase in single positive CD4+ and CD8+ cells are significant in morphine-treated wild-type mice compared with saline-treated animals. Morphine administration does not induce any significant change in the cellular distribution of mutant mice.

