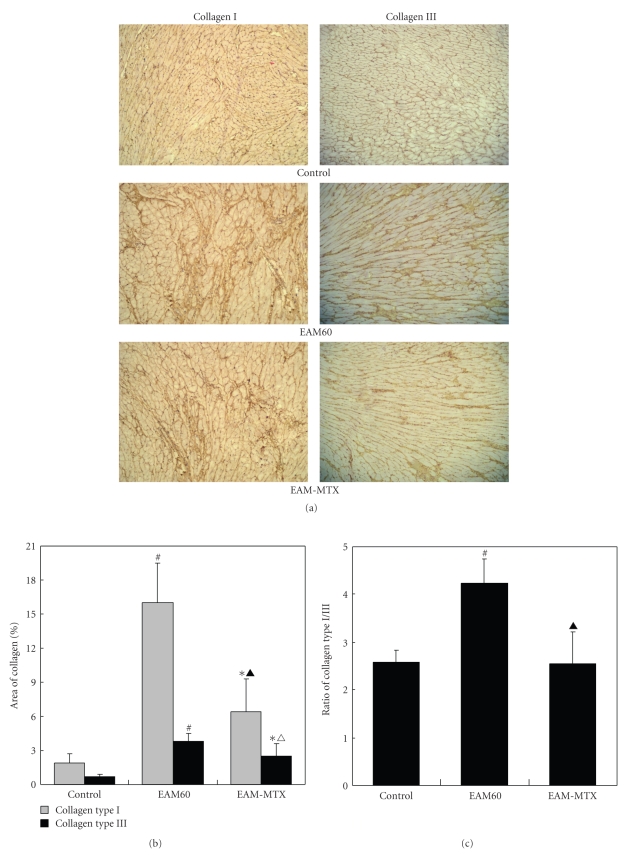
Figure 4.
Collagen types I and III staining. Representative photomicrographs of ventricular sections from the three groups of rats are shown ((a); ×200). The areas of collagen types I and III were, measured (b) and the ratios of collagen type I/III were calculated (c). All results are represented as mean ± SD (n = 10). *P < .05, # P < .01 versus control group; △ P < .05, ▲ P < .01 versus EAM60 group.

