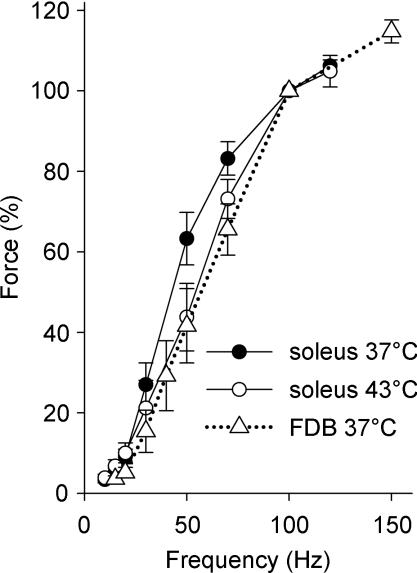
Figure 2. The force–frequency relationship was shifted to higher frequencies in soleus fibres at 43°C as compared to 37°C.
Mean (±s.e.m.) data from soleus fibres stimulated at 37°C (•, n= 8) and 43°C (○, n= 7). For comparison, data from FDB fibres at 37°C are also included (▵, n= 11, dotted line). The force at 100 Hz was set to 100% in each fibre.

