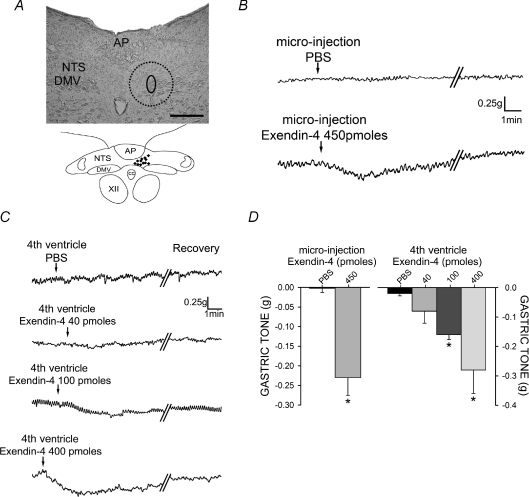
Figure 3. GLP-1 receptor activation in the DVC dose-dependently mediates gastric inhibition.
A, histological verification of DVC microinjection sites. Top, a representative photomicrograph of a 40 μm thick brainstem injection site with the region of the injection circled including the potential region of diffusion (dotted line) into the DMV and adjacent NTS. Bottom, a cumulative schematic representation of injection areas. Scale bar = 200 μm B, representative trace showing that microinjection of exendin-4 produces a rapid gastric inhibition. Parallel oblique lines indicate a 2–4 min break in the recording. C, representative traces of the dose-dependent gastroinhibition following 4th ventricle application of exendin-4. D, summary graph of gastroinhibition following microinjection and 4th ventricle application of exendin-4. *P < 0.05 vs. PBS.

