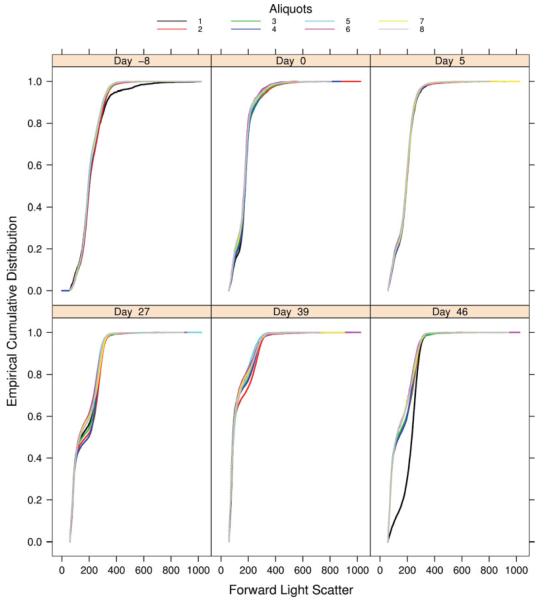
Fig. 1.
ECDF plots of the FSC values for the aliquots (A1–A8) from one patient at different time points (GvHD experiment). Each panel corresponds to a particular time point, in days before or after transplantation. In each panel, each curve represents one of the eight aliquots obtained from the blood sample of one particular patient. At day 46 after graft, the ECDF for aliquot A1 deviates from the others; it should be investigated further.

