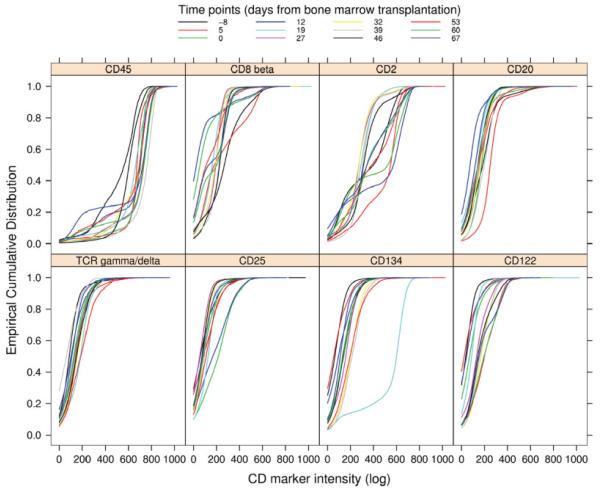
Fig. 2.
ECDF plots of the intensities of the phycoerythrin (PE) parameter for the stains from one patient, across time (GvHD experiment). Each panel corresponds to one particular CD molecule (attached to a specific subpopulation of cells) targeted by the PE fluorochrome. Inside a panel, each curve represents a different time point, in days before and after transplantation. The ECDF for CD134 at 19 days dramatically deviates from the rest, suggesting a staining error.

