
Fig. 3.
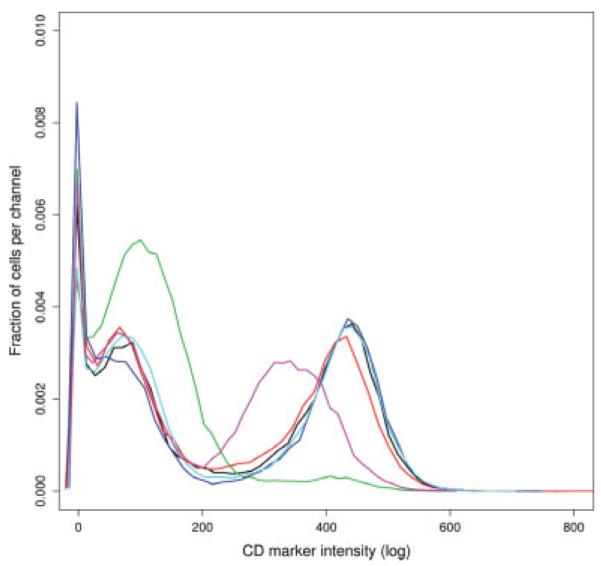
Unity normalized histogram plots of the intensities of one CD molecule targeted in several aliquots of one particular sample to identify different immune cell lineages of interest (GvHD experiment). Each curve represents one particular aliquot of a sample at a particular time point. The curves are multimodal. The first mode represents dead cells. The other modes correspond to different populations of cells.