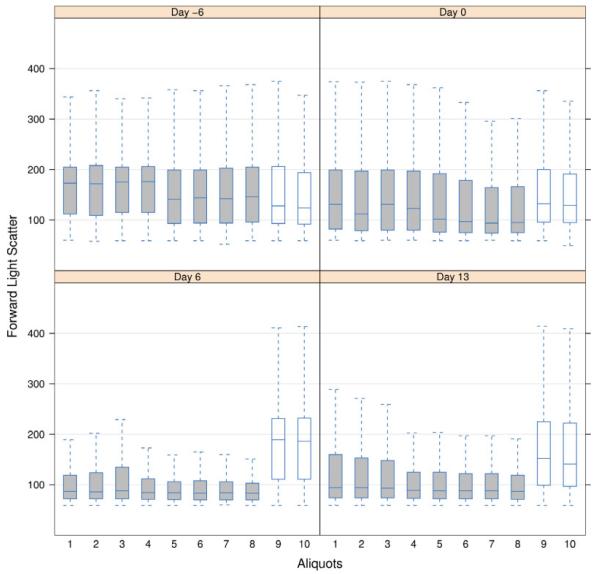
Fig. 4.
Boxplots of the FSC parameter for the 10 aliquots obtained from one patient (GvHD experiment). Each boxplot displays the three quartiles of the distribution. The whiskers extend to 1.5 times the interquartile range. The central box of the plot extends from the first (25%) to the third (75%) quartile and encompasses the median (50%) of the data. Boxplots are colored according to the plate location of the aliquot (grey: plate no. 1; white: plate no. 2).

