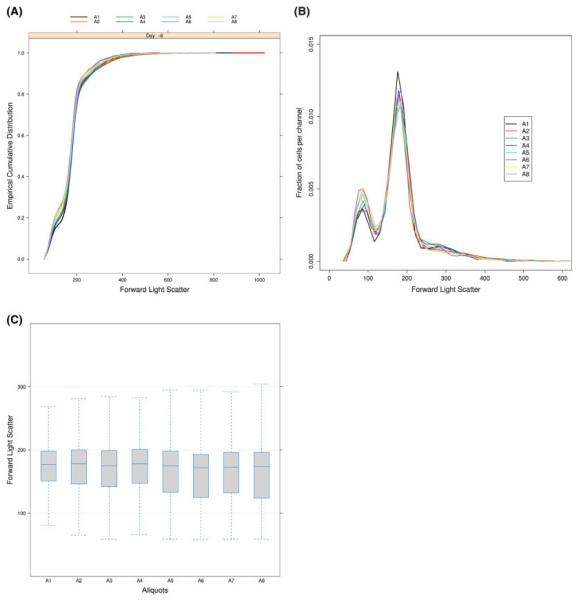
Fig. 5.
Different ways of viewing the 8 aliquots (A1–A8) of the same sample (GvHD experiment). Each curve or boxplot represents one particular aliquot of a sample taken at one time point. (A) The ECDF plot of the FSC values reveals subtle differences at the lower hand of the distributions; (B) The density plot of the FSC intensities presents the multimodal aspect of the distributions; (C) The boxplots of the FSC intensities show their asymmetries and their differences in location.

