
Fig. 6.
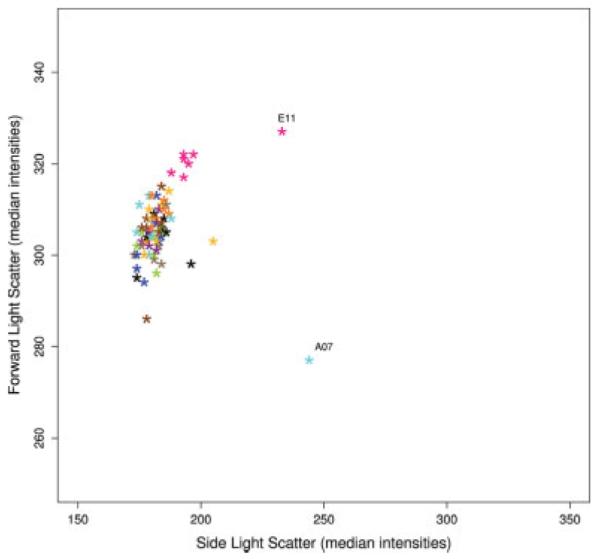
Scatterplot of the median intensity values of the FSC versus SSC parameters for each well of a 96-well plate (Rituximab experiment). The dots representing the median intensities of the samples are colored according to their column position in the plate.