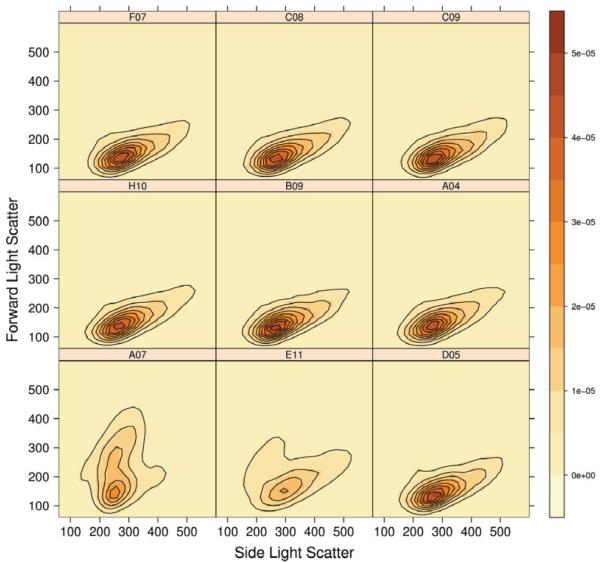
Fig. 7.
Contour plots of the FSC versus SSC parameters for 9 wells of a 96-well plate (Rituximab experiment). The title of each panel corresponds to the well position in the plate. A07 and E11 are the two previously described outlier wells while the other seven were randomly selected. The color scale goes from light to dark according to the density of cells per well, from low to high respectively.

