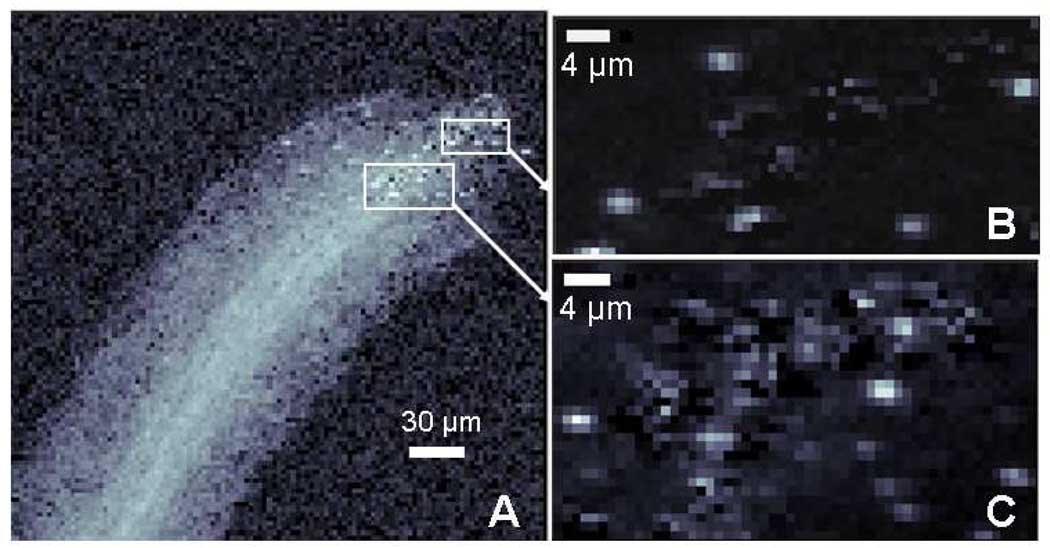
Figure 3.
Microprobe map of Hg fluorescence on logarithmic scale shows size and distribution of Hg within micron-sized S. foliosa roots (A). Micro-XANES points were selected from the highest concentration areas (“hot spots”, indicated white). Fluorescent counts (range 0–603) in insets (B and C) were determined as a difference above the Hg edge (12300 eV), minus below (12250 eV).

