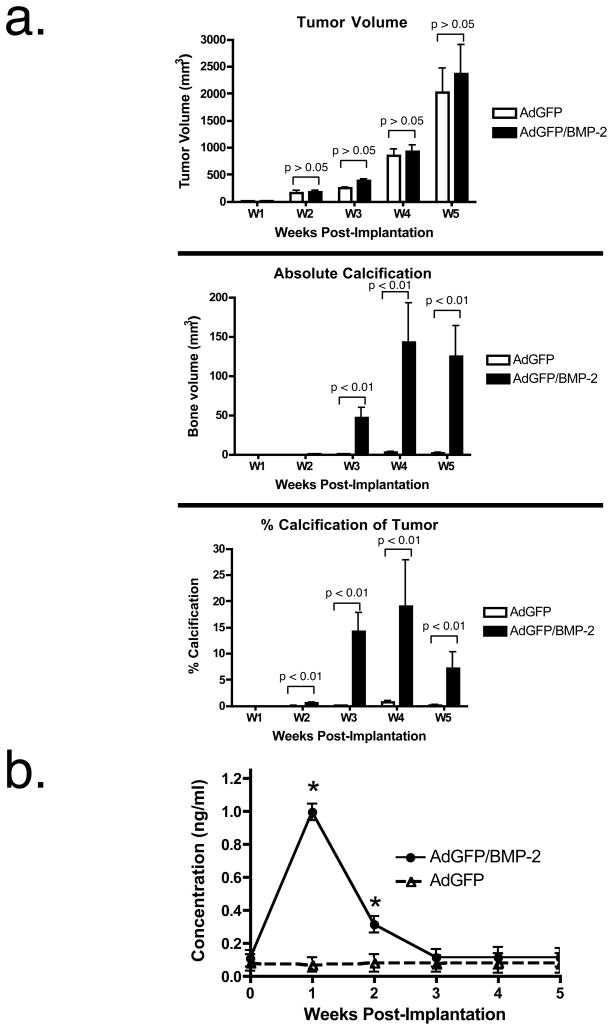
Figure 3. Kinetics of breast tumor growth, microcalcification formation, and serum BMP-2 levels.
a. Rats with AdGFP transduced breast tumors (white bars) or AdGFP/BMP-2-transduced breast tumors (black bars) were scanned weekly by microCT and breast tumor volume (top), microcalcification volume (middle), and percentage of microcalcification per tumor (bottom) were quantified. Shown are means ± SEM for N = 8 rats per condition.
b. BMP-2 serum ELISA from rats bearing AdGFP/BMP-2 tumors. Shown are mean ± SEM (N = 3 rats per condition). Asterisks denote statistically significant differences from the control (p < 0.01) as measured using a two-tailed Student’s t-test.

