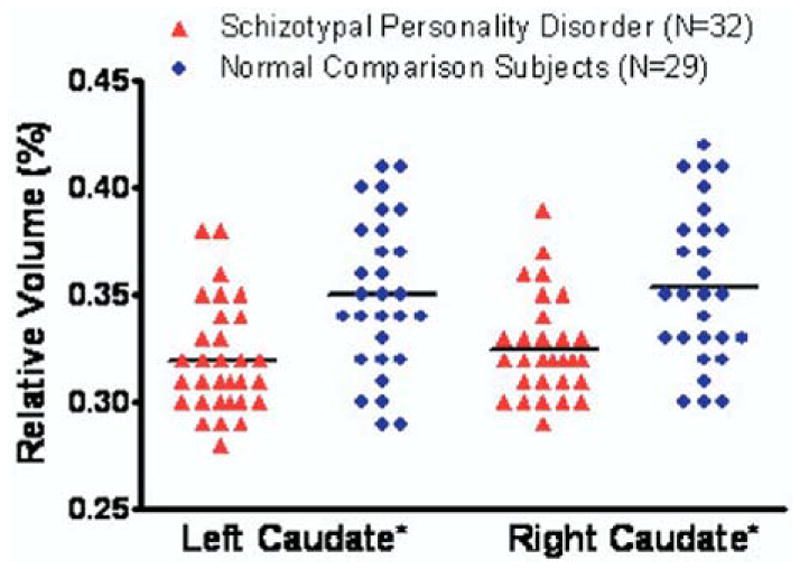
Figure 2.

Scatter plots of left and right relative caudate nucleus volumes in female schizotypal personality disorder and normal comparison subjects. *Follow-up planned contrasts applying Student’s t tests showed that left [t(46.6) = −3.43, p < .01] and right [t(45.9) = −3.23, p = .01] caudate relative volumes were significantly smaller in subjects with schizotypal personality disorder than in normal comparison subjects. Horizontal lines represent means.
