Figure 2.
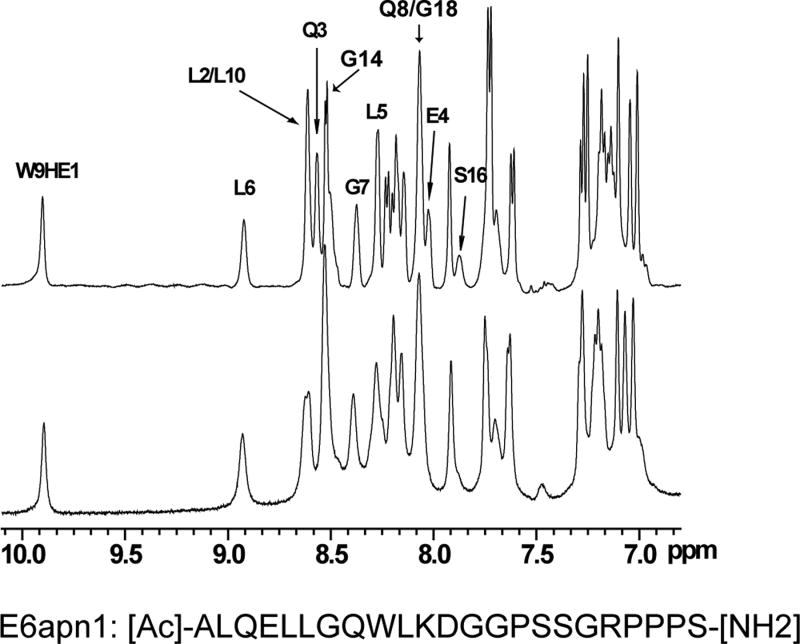
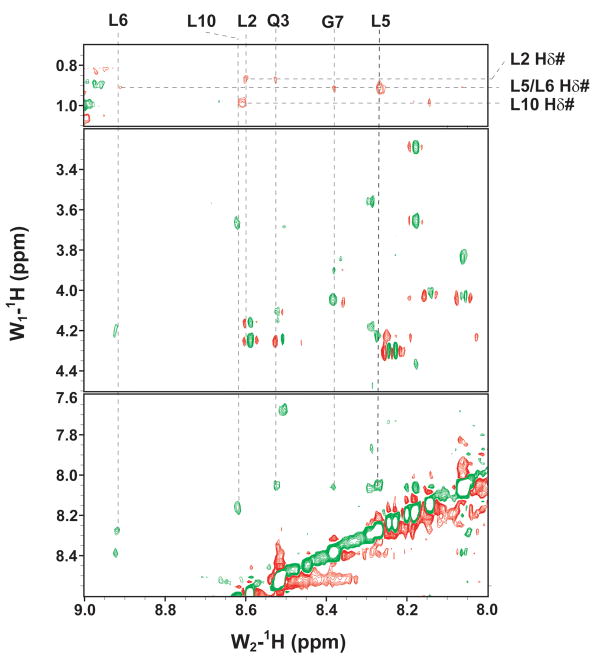
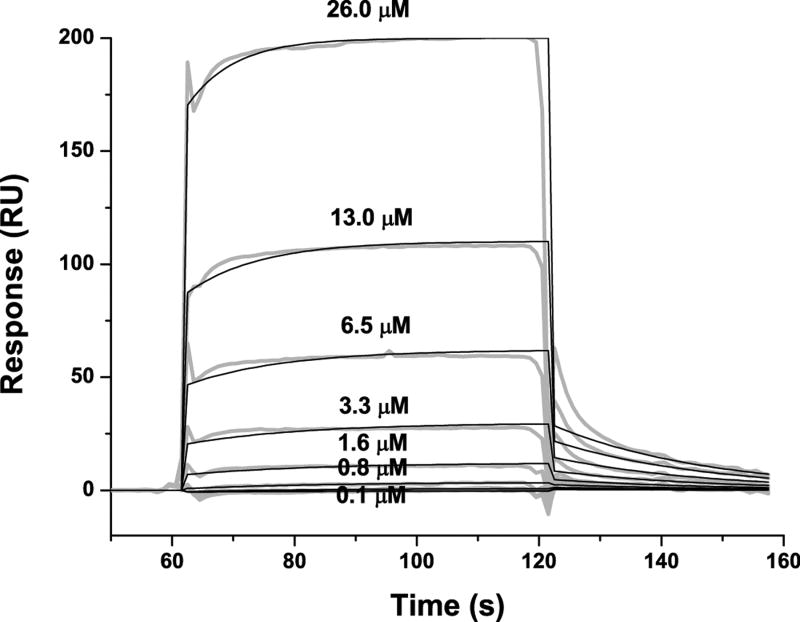
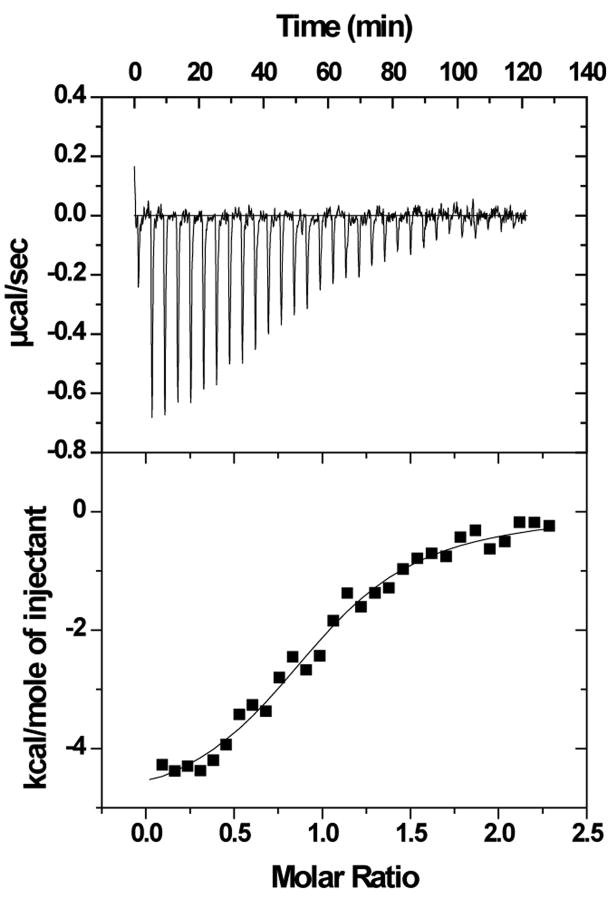
The binding of purified E6 proteins to E6 targets. (A) One-dimensional NMR spectra of E6apn1 peptide (2.0 mM) in the absence (top) and in the presence of (bottom) of GBF-E6 protein (200 μM) in 50 mM phosphate (pH 7.50) with 200 mM NaCl at 5 °C. The indicated assignments are based on our previous report.29 (B) The NOESY difference spectrum of E6apn1 peptide with and without GBF-E6 protein. Increases in peak intensity are shown in red and decreases in peak intensity are in green. (C) SPR analysis of the interaction of GBF-E6 and E6apc2 peptide in 20 mM phosphate (pH 6.50). E6apc2 was immobilized to the CM5 sensor surface and a series of GBF-E6 solutions allowed to flow over the surface. The experimental curves are shown in gray, the fits shown in black. (D) ITC analysis of the interaction of hDlg PDZ2 domain and E6CL peptide in 20 mM phosphate (pH 6.50). A 500 μM solution of hDlg PDZ2 was injected 30 times in 10 μl aliquots into the 1.4 ml sample cell containing GBF-E6CL at a concentration of 50 μM at 20 °C.


