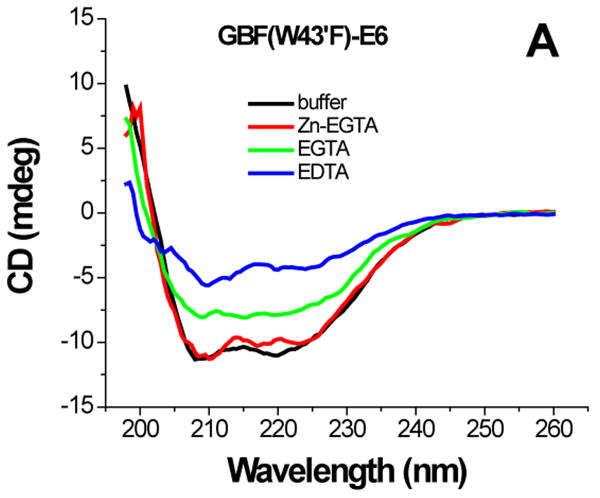
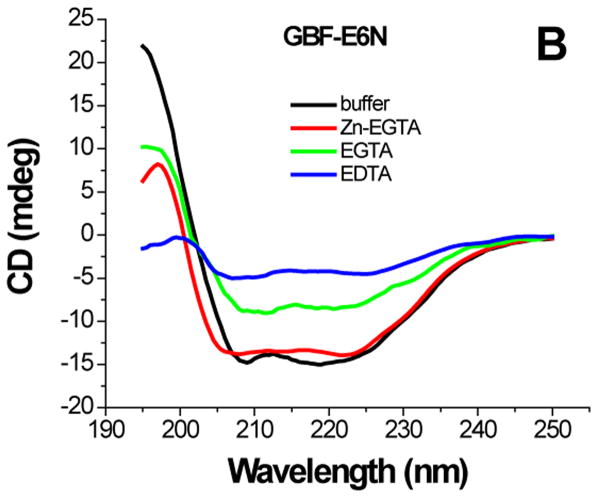
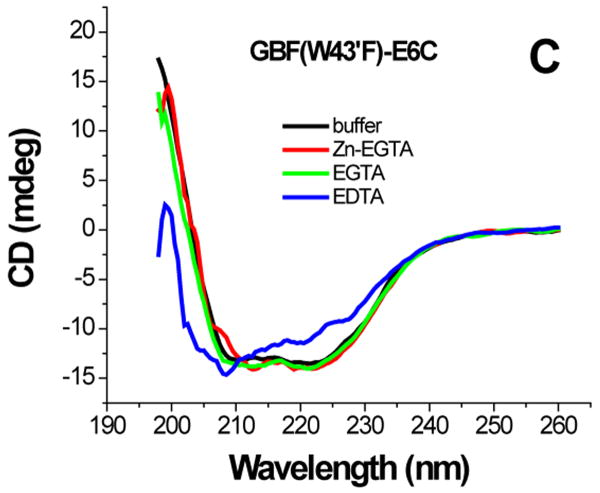
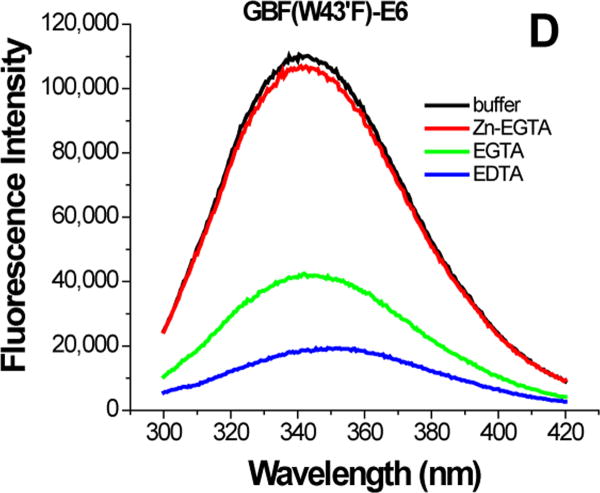
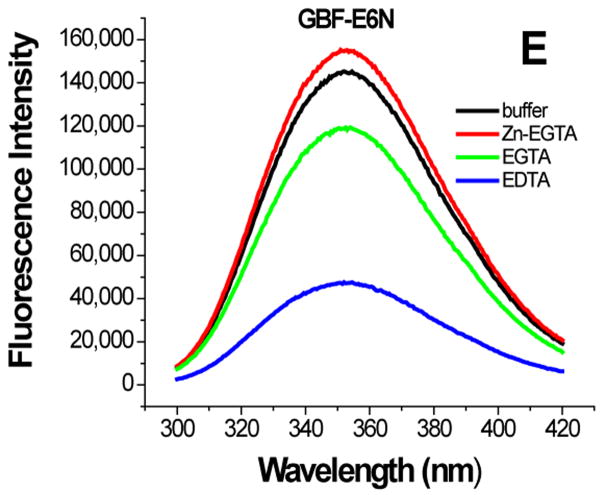
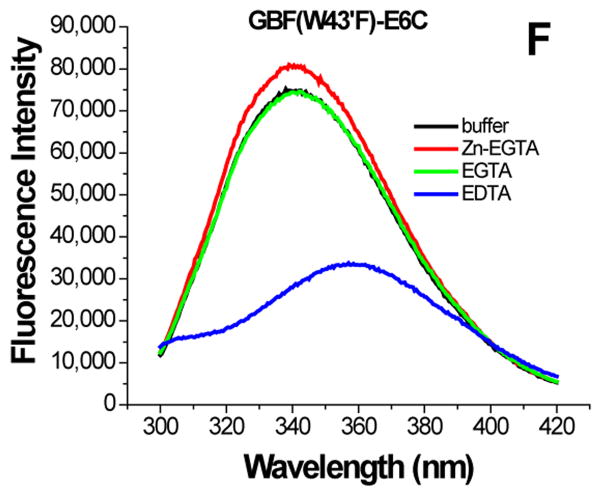
Figure 6.
The effect of zinc binding on HPV E6 structure. (A), (B), and (C) show the CD spectra of GBF-E6, GBF-E6N, and GBF-E6C and (D), (E), and (F) show the fluorescence spectra of GBF(W43′F)-E6, GBF-E6N, and GBF(W43′F)-E6C. GBF(W43′F)-E6 was 5 μM and GBF-E6N and GBF(W43′F)-E6C were 10 μM. The buffers used were 50 mM phosphate, pH 6.50 (black), 50 mM phosphate, pH 6.50 with 8 mM Zn-EGTA (red), 50 mM phosphate, pH 6.50 with 8 mM EGTA (green), 50 mM phosphate, pH 6.50 with 8 mM EDTA (blue).

