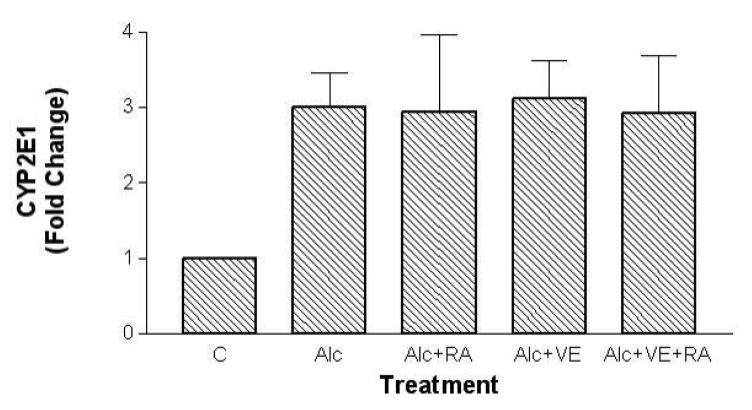
Fig. 1.
Effects of retinoic acid (0.1 mg/kg body weight) and vitamin E (2.0 mg/kg body weight) supplementation on hepatic CYP2E1 protein levels in rats fed with ethanol for a one-month period. Western Blotting analyses were followed by densitometric analysis. All samples in each pair-feeding group were run on the same blot. The band intensities of samples in four treatment groups were compared to the band intensity of a control sample on the same blot, and expressed as fold increase compared with the control. Mean ± SD (n= 3 - 5 per group). C, control; Alc, ethanol; RA, retinoic acid; VE, vitamin E.

