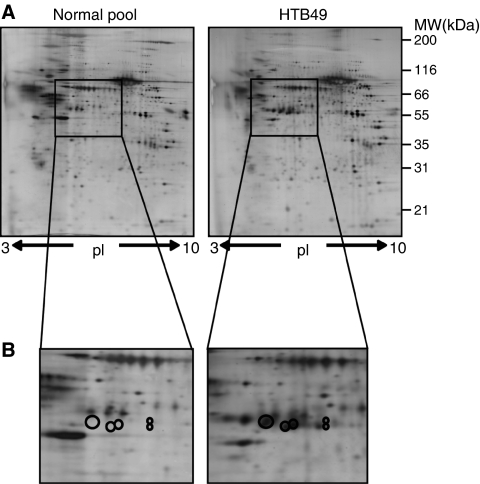
Figure 1.
Conditioned media analysed by 2D PAGE. (A) A measure of 30 μg of HTB49 and pooled normal renal culture CM were separated on 18 cm pI 3–10 IPG strips in the first dimension. Each sample was run and analysed in triplicate and representative gels are shown. (B) The location of cathepsin D as a cluster of spots is shown, which was enriched in CM compared with lysate and increased in RCC CM compared with normal renal primary CM.

