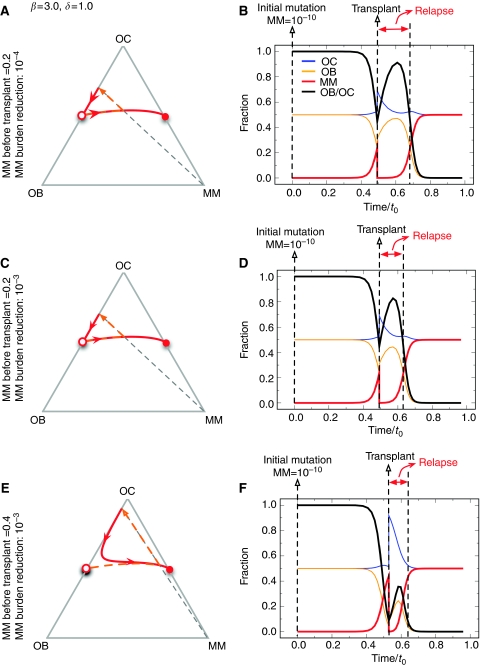
Figure 4.
Population dynamics in response to therapy. Starting with different fractions of multiple myeloma (MM) cells (A, C and E), we determined the population trajectories as a function of reduction in MM burden (B, D and F). The general behaviour did not change across a wide range of parameter values. However, the speed of relapse is related to the starting size of the MM population. Note that the OB : OC ratio does not return to normal as long as MM cells persist.

