
FIGURE 3.
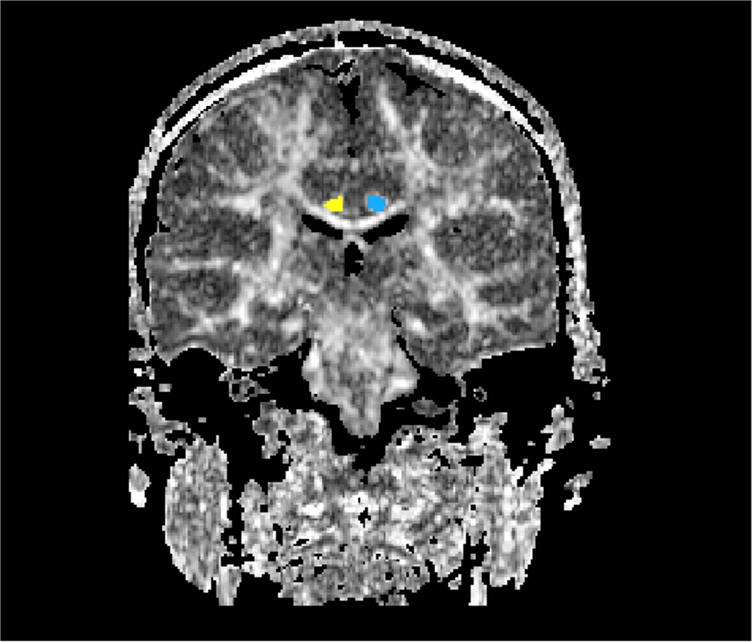
An FA map is displayed of a normal control subject, with the ROI for the cingulum bundle displayed as blue on the left and yellow on the right.
Official websites use .gov
A
.gov website belongs to an official
government organization in the United States.
Secure .gov websites use HTTPS
A lock (
) or https:// means you've safely
connected to the .gov website. Share sensitive
information only on official, secure websites.
An FA map is displayed of a normal control subject, with the ROI for the cingulum bundle displayed as blue on the left and yellow on the right.