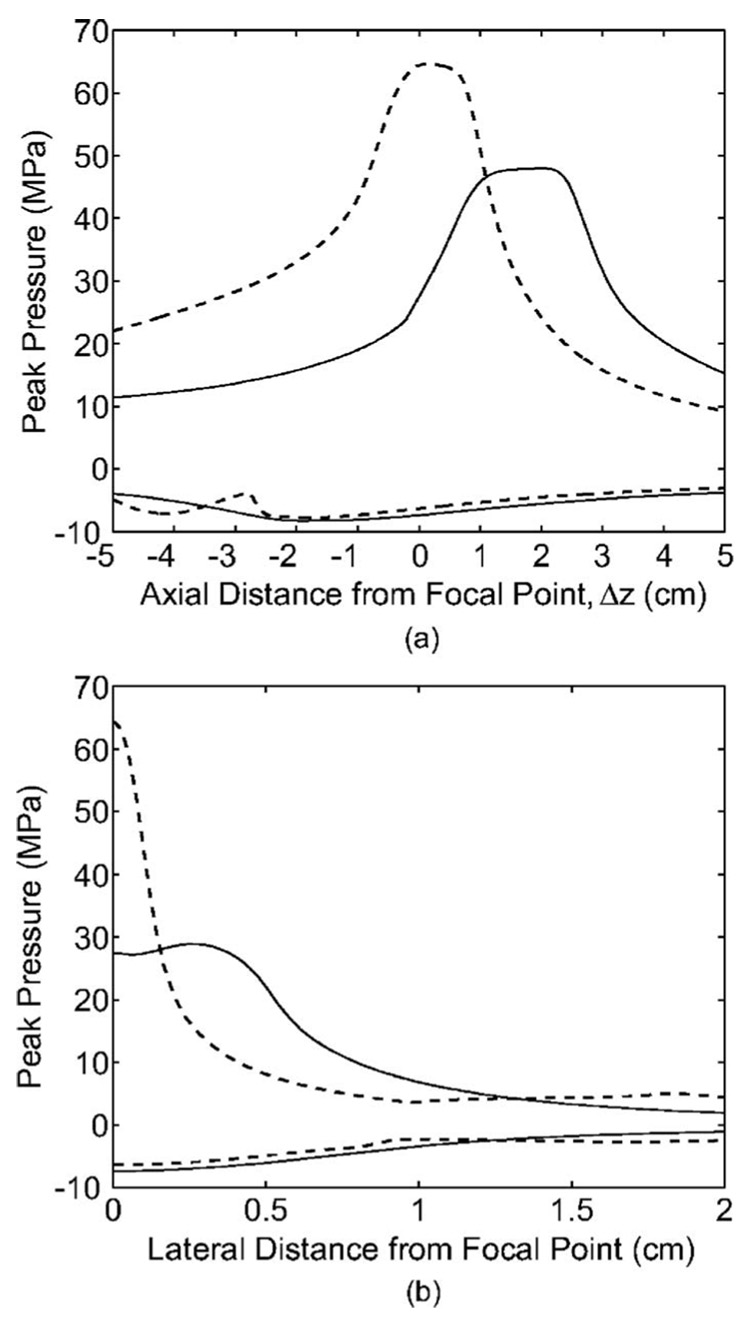
FIG. 11.
Distribution of the peak pressures along the symmetry axis (a) and transverse axis at F2 (b) generated by the original reflector (solid) and upgraded reflector (dashed). The curves with positive/negative pressure values correspond to the peak positive/negative pressure for each reflector design.

