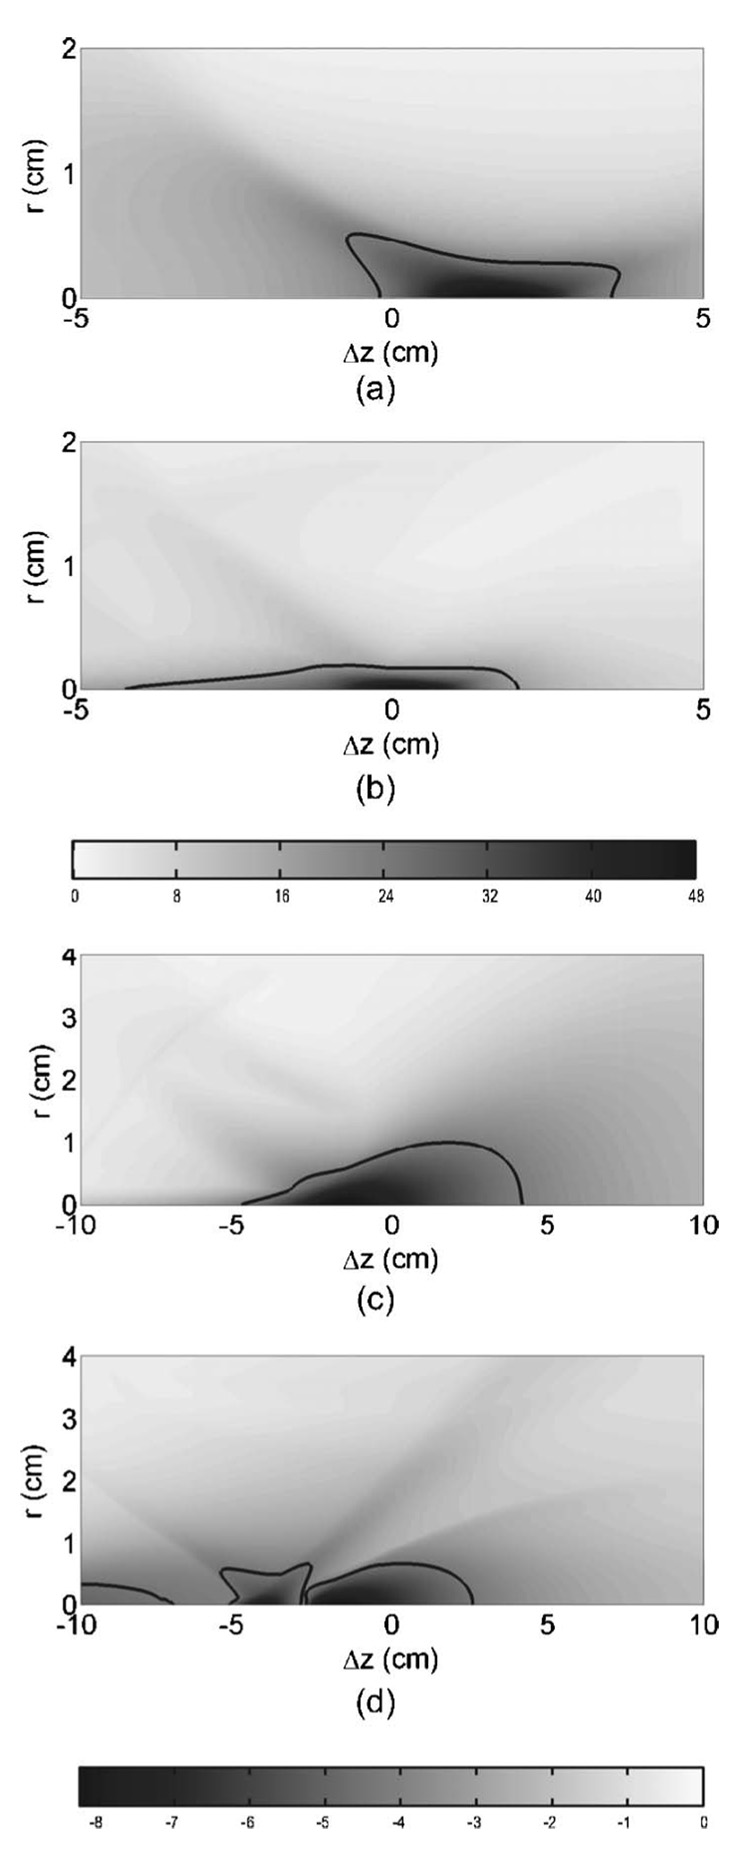
FIG. 13.
A comparison of the peak pressures (MPa) is shown in grayscale. The contours of the −6 dB regions P{with respect to the peak positive [(a) and (b)] and negative [(c) and (d)]} are outlined for the original [(a) and (c)] and upgraded reflectors [(b) and (d)]. The −6 dB contours for the upgraded reflector corresponds to the −6 dB pressures for the original reflector. The r-scale is exaggerated and the z-range is different between the positive and negative plots for better visualization of differences.

