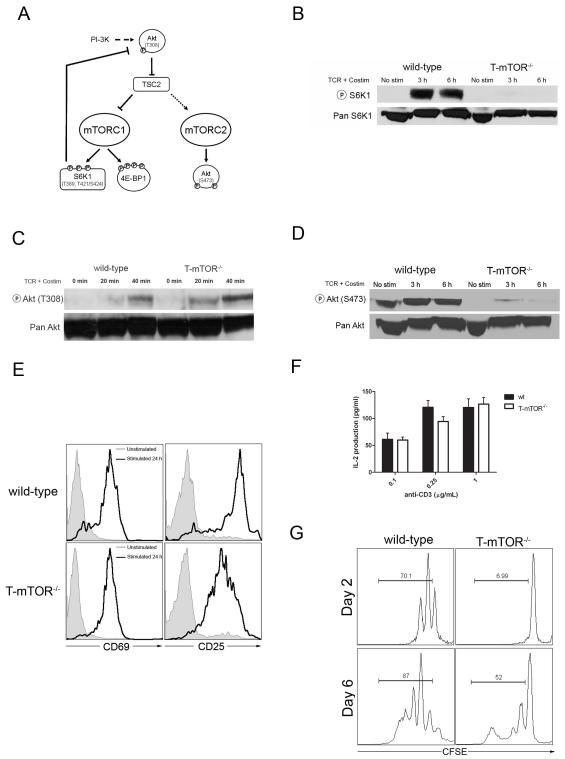
Figure 2.
Characterization of T cell function in mTOR deficient T cells. (A) mTOR signaling proceeds through two complexes. (B) IB of phospho-S6K1 from CD4+ T cells stimulated with immobilized anti-CD3 (1μg/mL) and anti-CD28 (2μg/mL) for the indicated times. (C) IB of phospho-Akt (T308), as in B. (D) IB of phospho-Akt (S473), as in B. (E) Activation markers upon stimulation. Cells were gated on CD4 after 24 hours of mock or anti-CD3 stimulation. (F) IL-2 production from initial stimulation of mTOR deficient T cells. Data are pooled from three independent experiments. Error bars indicate S.D. (G) Proliferation analysis of mTOR deficient T cells by CFSE dilution. Plots are gated on CD4+ T cells. Gates indicate cells that have undergone at least one division. All data are representative of at least three independent experiments.

