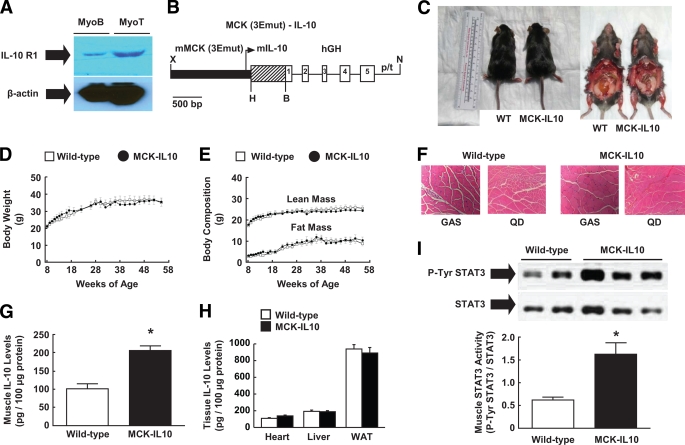
FIG. 2.
Transgenic mice with muscle-specific overexpression of IL-10 (MCK-IL10). A: IL-10R1 protein expression in C2C12 myoblast and myotube cells. B: Map of MCK-IL10 construct. C: Photographs of MCK-IL10 mice and WT littermates. D: Body weight. E: Whole body lean and fat mass. F: Hematoxylin-eosin staining of gastrocnemius (GAS) and quadriceps (QD) muscle. G: Muscle IL-10 protein levels. H: Plasma and local IL-10 protein levels in heart, liver, and white adipose tissue (WAT). I: STAT3 activity (Tyr705phosphorylation of STAT3) in skeletal muscle. Values are means ± SE for six to eight mice in each group. *P < 0.05 vs. WT mice. A Student's t test was used for statistical analysis. (A high-quality color digital representation of this figure is available in the online issue.)

