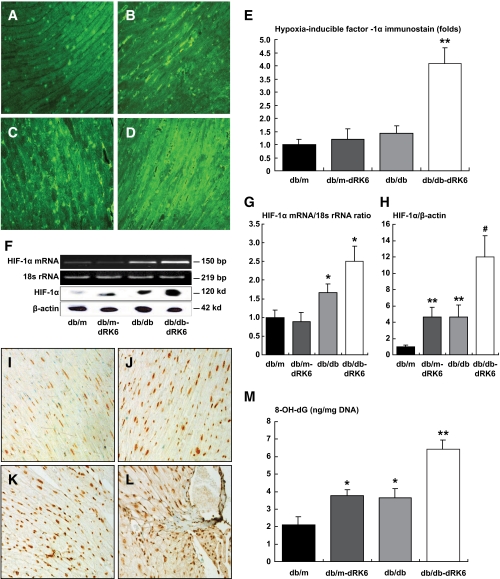
FIG. 6.
Immunofluorescent staining for HIF-1α in the heart. Representative pictures illustrating expression in nondiabetic db/m (A), db/m-dRK6 (B), diabetic db/db (C), and db/db-dRK6 mice (D) in myocytes. Original magnification ×200. E: Quantitative assessment of HIF-1α immunoreactivity in the myocardial cells in diabetic db/db and nondiabetic db/m mice with or without dRK6 treatment. **P < 0.001 compared with the other groups. F: Expression of HIF-1α protein, mRNA, and 18s rRNA in the hearts of the study groups. Quantitative assessment of the expression of HIF-1α mRNA (G) and protein (H). *P < 0.05, **P < 0.01 compared with the other groups, #P < 0.01 compared with the db/db group; n = 4. Immunohistochemical expression of 8-OH-dG protein in myocardial cells. In diabetic db/db mice (K), 8-OH-dG protein is markedly accentuated in the myocardium (dark nucleus) compared with nondiabetic db/m and db/db-dRK6 mice (I and J, respectively). More prominent 8-OH-dG immunostaining is seen in the db/db-dRK6 mice compared with the diabetic db/db mice (L). Original magnification ×200. M: Quantitative assessment of 8-OH-dG levels in the DNA from the hearts. *P < 0.05, compared with db/m, **P < 0.01 compared with db/m and P < 0.05 compared with db/m-dRK6 and db/db; n = 4. (A high-quality color digital representation of this figure is available in the online issue.)

