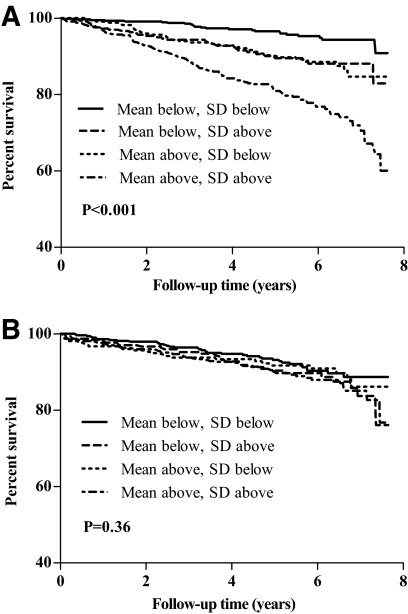
FIG. 2.
A: Kaplan-Meier survival curves for any progression in renal status (defined as any increase in albuminuria level or progression to ESRD) according to mean and SD of serial A1C above and below the population median. B: Kaplan-Meier survival curves for a CVD event (coronary event, stroke, peripheral vascular event) according to mean and SD of serial A1C above and below the population median.

