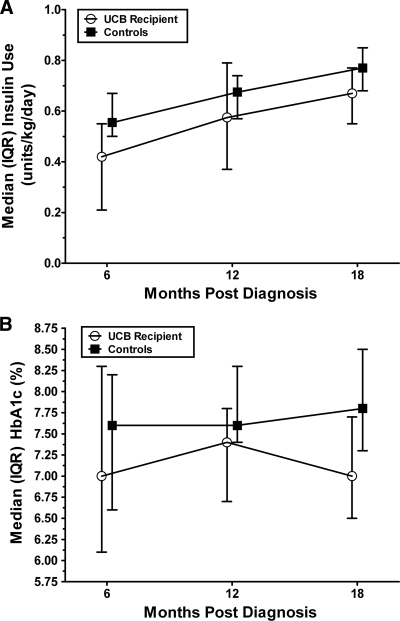
Figure 2.
Insulin use (A) and A1C (B) in umbilical cord blood recipients and historical control subjects over 1 year. Data are medians with error bars showing IQRs and are presented for the sake of comparison with clinical expectations. Because the average time from diagnosis to umbilical cord blood infusion was 6 months, comparisons correlate with 6, 12, and 18 months post–type 1 diabetes diagnosis in both umbilical cord blood recipients and historical control subjects. Whereas the absolute value of A1C and insulin requirement in umbilical cord blood recipients was lower than that in control subjects at baseline, 6 months, and 12 months, the relevant statistical comparison of percent change was no different over time (Table 2).

