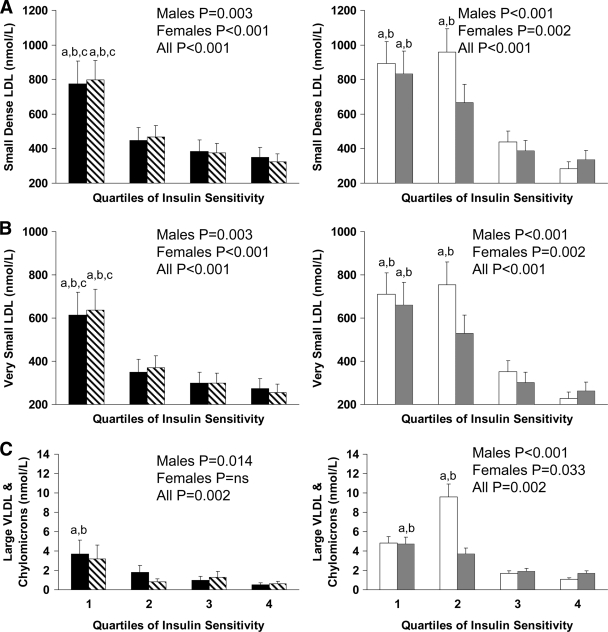
Figure 3.
Concentrations of small (A) and very small (B) LDL, and large VLDL and chylomicrons (C), by quartiles of insulin sensitivity in black male (■) and female (▧) and white male (□) and female ( ) children. Differences were compared using one-way ANOVA with post hoc Tukey correction. a, significant difference versus 4; b, significant difference versus 3; c, significant difference versus 2; P < 0.05.

