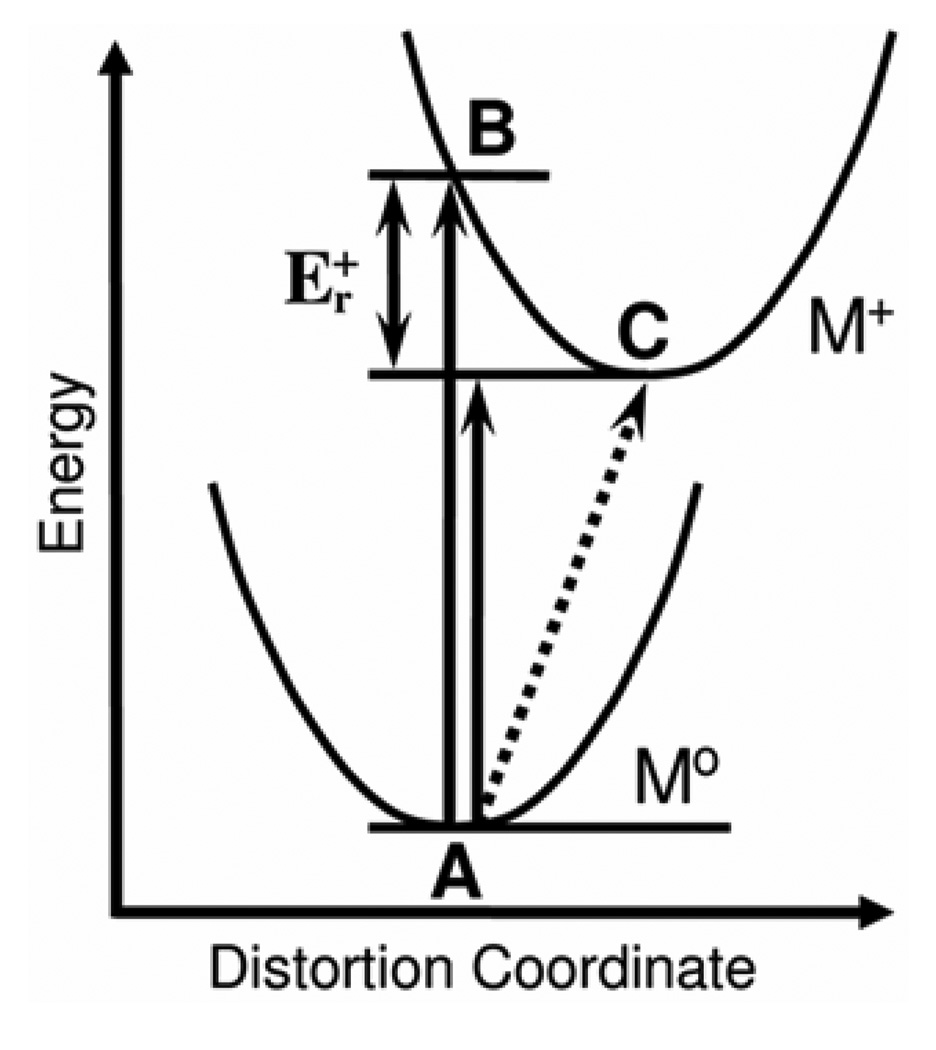
Figure 2.
Diagram illustrating the relationship among photoelectron ionization energies, cation reorganization energies, and electrochemical measurements for classical potential wells with unresolved vibrational structure. The vertical arrows represent spectroscopic ionization energies measured in the gas phase on the fast time scale of photoelectron spectroscopy, and the dashed line represents the free energy of oxidation measured in solution on the slower time scale of cyclic voltammetry. See the introduction section for further explanation.

