
Figure 2.
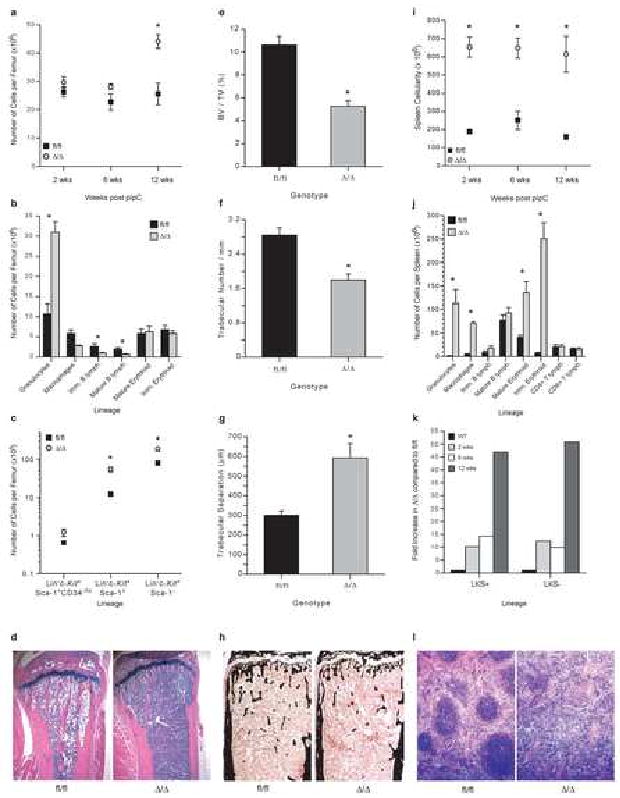
Myeloproliferation following Rb deletion.
A) Femoral cellularity, n≥3/genotype/time point. B) Number of cells of each lineage/femur at 12 wks post pIpC; Granulocytes CD11b+Gr-1+, Macrophages CD11b+F4/80+, Immature B lymphoid IgM-B220+, Mature B lymphoid IgM+B220+, Mature Erythroid CD71-Ter119+, Immature Erythroid CD71+Ter119+; n≥8/genotype; *P<0.01. C) Number of phenotypic HSCs (LKS+CD34-/lo) and primitive progenitors/femur; 12 wks post pIpC; n≥5/genotype; *P<0.05. D) Representative sections of tibiae at 12 wks post pIpC. E) Volume of marrow space occupied by bone (BV/TV); 2 wks post pIpC; n≥13/genotype; *P<0.05. F) Trabecular number/mm; *P<0.05. G) Separation of trabeculae; *P<0.05. H) Representative longitudinal sections of tibiae stained with Von Kossa technique (mineralised bone stained black). I) Spleen cellularity; n≥3/genotype/time point; *P<0.01. J) Number of cells of each lineage/spleen; 12 wks post pIpC; n≥8/genotype; *P<0.01. K) Fold change in phenotypic LKS+ and LKS- in the spleen; n≥3/genotype/time point; P<0.05. L) Representative spleen sections (12 wks post pIpC). Unless noted all data expressed as mean ± SEM.