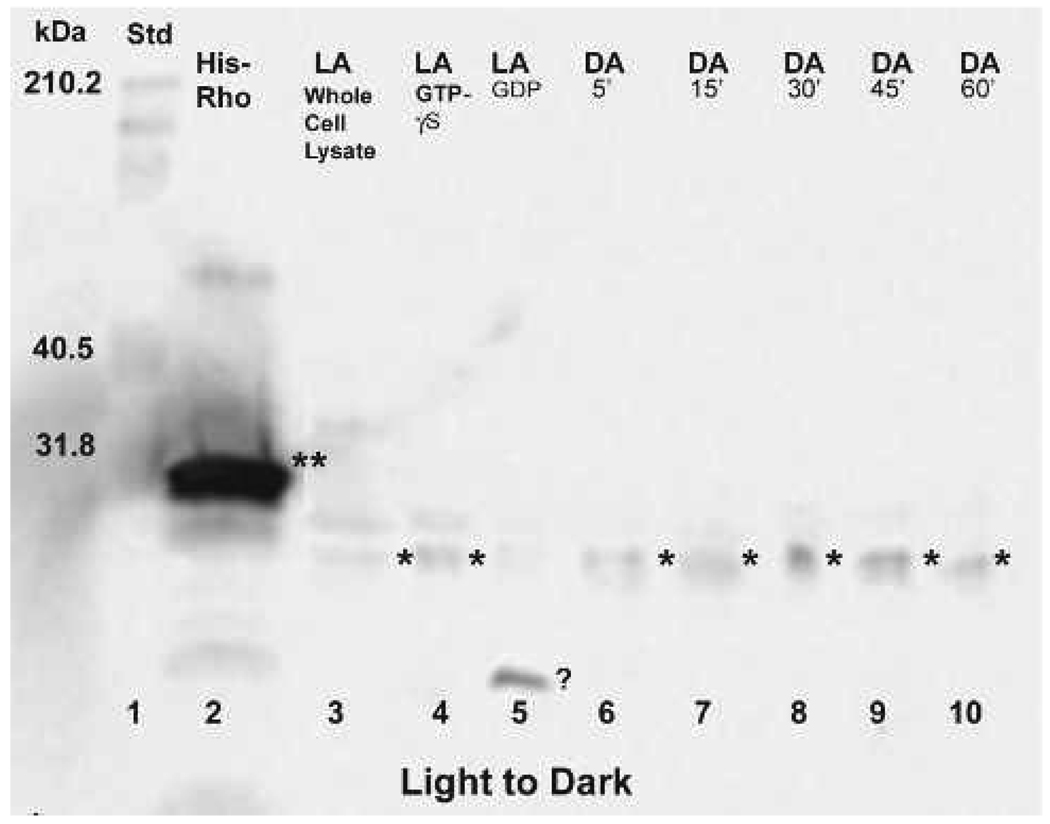
Figure 4.
Rho pull-down assay showing Rho activation in light-adapted retinas that were moved to the dark and sampled at 5, 15, 30, 45, and 60-minute time points after the shift. Activated Rho, migrating between 20–22 kDa (⋆) is visible at all time points, most notably and strongly at 30 and 45 minutes. For comparison, Rho can be seen in the whole cell lysate (lane 3). There is little or no activation in the light-adapted GDP control (lane 5), but there is a strong band below 20 kDa (question mark) whose identity has not been determined. His-tagged RhoA control protein (⋆⋆) migrating between 25–27 kDa is in lane 2.

