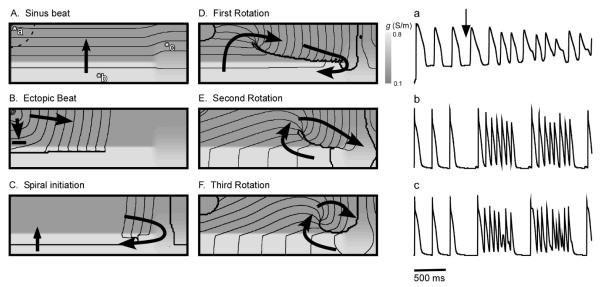
Figure 2.
Bursting in the pulmonary veins triggered by a sudden reduction in heart rate. A-F: Initiation of a spiral wave by an ectopic beat originating in the pacemaker region. Black lines are isochrones, spaced 5 ms apart, arrows indicate the direction of wave propagation. A: Sinus activation. B: Ectopic wave originated in the pacemaker region is blocked at the interface of the areas with reduced (medium gray) and normal (light gray) coupling . C: The ectopic beat penetrates into the normally conducting region, collides with the next sinus front, and reenters the low conduction region (upward arrow) forming a spiral wave. D-F: Subsequent evolution of the spiral wave. a-c: Transmembrane voltage signal at three different locations (marked in Panel A). Three sinus stimulations, followed by two high-frequency bursts. Bursting starts after a slowdown in the pacing rate from 500 ms to 800 ms.

