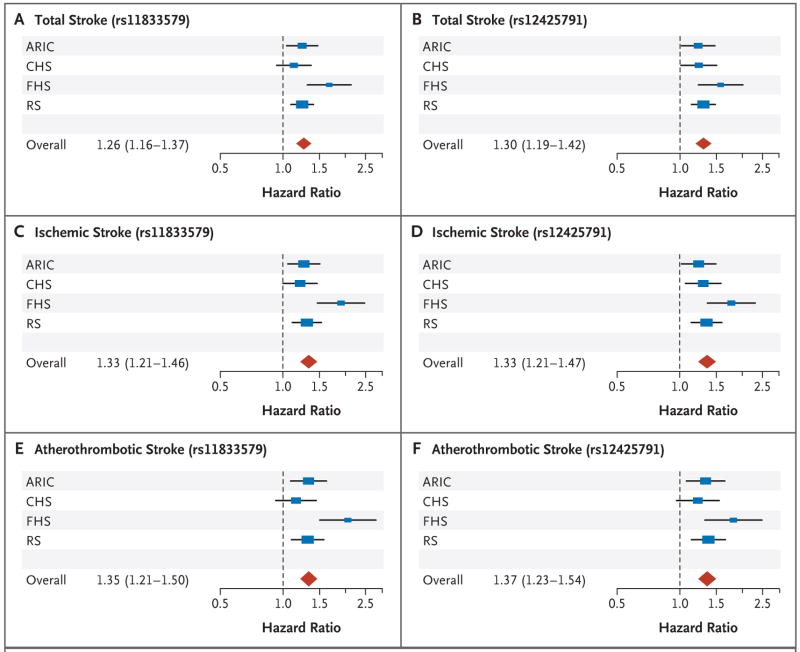
Figure 2. Forest Plots Showing Associations between Single-Nucleotide Polymorphisms and Total, Ischemic, and Atherothrombotic Strokes.
The associations between rs11833579 and total stroke (Panel A), ischemic stroke (Panel C), and atherothrombotic stroke (Panel E) and between rs12425791 and total stroke (Panel B), ischemic stroke (Panel D), and atherothrombotic stroke (Panel F) are based on directly genotyped data. Individual studies (blue boxes) are plotted against the individual effect sizes (hazard ratios). The red diamonds indicate the overall hazard ratios. The size of the blue box is inversely proportional to the variance. Horizontal lines indicate 95% confidence intervals. The dashed vertical line in each panel shows the value for no effect (hazard ratio = 1.0). ARIC denotes Atherosclerosis Risk in Communities study, CHS Cardiovascular Health Study, FHS Framingham Heart Study, and RS Rotterdam Study.

