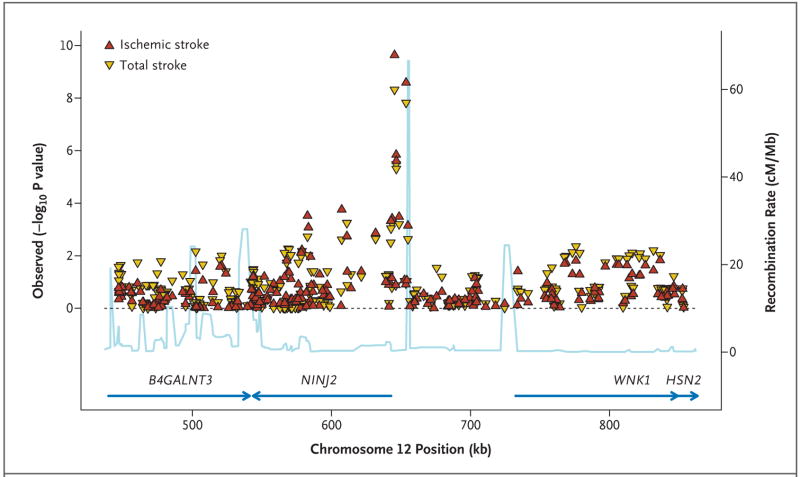
Figure 3. Associations in the Region Centered on rs11833579 and Containing NINJ2.
All single-nucleotide polymorphisms are plotted with their P values (on combined analysis) against their genomic position. P values for total stroke and ischemic stroke are shown. The light blue line represents the estimated recombination rates. Blue arrows indicate gene annotations.

